Download
1 / 36
370 likes | 569 Vues
Natural and Anthropogenic Carbon Changes in the South Indian Ocean. 1. Claire Lo Monaco, Andrew Lenton and Nicolas Metzl (LOCEAN-IPSL, Paris). Scientific context. Plan. Ocean acidification Feedback on climate change. Carbon Budget 2007 (Global Carbon Project, 2008)

E N D
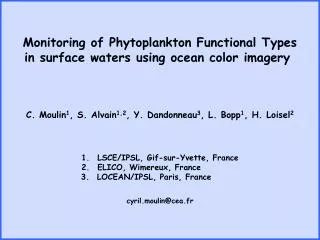
Natural and Anthropogenic Carbon Changes in the South Indian Ocean 1 Claire Lo Monaco, Andrew Lenton and Nicolas Metzl (LOCEAN-IPSL, Paris)
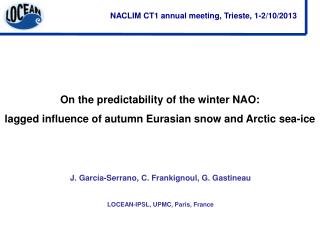
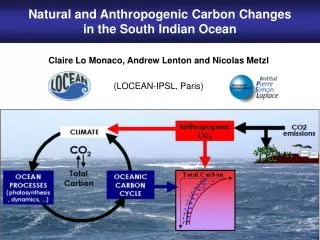
Scientific context Plan • Ocean acidification • Feedback on climate change Carbon Budget 2007 (Global Carbon Project, 2008) Conclusions: “Anthropogenic CO2 emissions have been growing about four times faster since 2000 than during the previous decade, […] Natural CO2 sinks are growing, but more slowly than atmospheric CO2, […] All of these changes characterize a carbon cycle that is generating stronger climate forcing and sooner than expected.”
Scientific context Plan • Ocean acidification • Feedback on climate change I. Observations Can we separate between anthropogenic and ‘natural’ carbon changes? II. Model-Data comparison Do coarse resolution Ocean-Carbon Models reproduce the observed changes? III. On-going/future work What drives DIC changes in the model? Would it be coherent with observations?
Data (1) I. Observations: sampling sites INDIGO1 : OISO 1-6 : Mean position of hydrological fronts after Belkin and Gordon (1996) Kerguelen Plateau Measurements of Total Carbon and the associated parameters (temperature, salinity, oxygen, alkalinity, nutrients, …) One cruise conducted in 1985 Six cruises conducted between 1998 and 2001 (interannual variability)
Data (2) I. Observations: sampling sites Mean position of hydrological fronts after Belkin and Gordon (1996) Kerguelen Plateau Large interannual variability can occur in the top 1000m of the ocean - in the frontal region (associated with movement of the SAF) - north of the SAF (mesoscale feature created by the Madagascar Current and the Agulhas Return Current Rodgers et al. (subm!)
Water masses (1) I. Observations: water masses Mean position of hydrological fronts after Belkin and Gordon (1996) Kerguelen Plateau AASW WW STSW STMW SAMW Upper CDW Total carbon distribution (µmol/kg)
Water masses (2) I. Observations: water masses Mean position of hydrological fronts after Belkin and Gordon (1996) • Deep winter mixing (down to ~500m) • Mode Waters formation Kerguelen Plateau AASW WW STSW STMW SAMW Upper CDW Total carbon distribution (µmol/kg)
I. Observations : carbon changes Back-calculation (preformed carbon method), Lo Monaco et al. (2005, JGR) Anthropogenic Carbon distribution [µmol/kg] Cant WW STMW SAMW Upper CDW Extended Multi-Linear Regression (eMLR) technique, Friis et al. (2005, DSR.I) Anthropogenic Carbon change over 15 years [µmol/kg] WW STMW SAMW Upper CDW Anthropogenic carbon increased by 5-10 µmol/kg in Mode Waters (over 15 years) ~1/6 of the total accumulation of anthropogenic carbon (over 200 years)
I. Observation : carbon changes Total Carbon (µmol/kg) Total Carbon (µmol/kg) AASW WW STSW No change +15±5 µmol/kg No change +6±3 µmol/kg STMW -5±4 µmol/kg no change Upper CDW SAMW 50°S 35°S Extended Multi-Linear Regression (eMLR) technique Only conservative tracers are used (Salinity, Temperature, NO) TCO2 changes Total Carbon change over 15 years [µmol/kg] WW STMW SAMW Upper CDW 50°S 35°S
I. Observation : carbon changes Anthropogenic Carbon changes (DCanth) [µmol/kg] WW STMW SAMW Upper CDW Total Carbon changes (DTCO2) [µmol/kg] WW STMW eMLR results (1) SAMW Upper CDW
I. Observation : carbon changes Anthropogenic Carbon changes (DCanth) [µmol/kg] WW STMW SAMW Upper CDW Total Carbon changes (DTCO2) [µmol/kg] WW STMW eMLR results (2) SAMW Upper CDW = + Natural Carbon change (DCnat) [µmol/kg] WW STMW SAMW Upper CDW
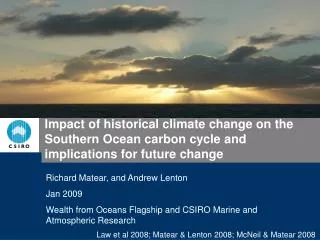
II. Model-Data comparison: model description MODEL description Ocean Carbon Model NEMO2 Components: Ocean Model OPA9 (GM90 and TKE mixed layer scheme), Biogeochemical Model PISCES (NPZD model), Ice Model LIM2 Resolution: 2°x 2° resolution (enhanced at the equator) 31 non -regular vertical levels (19 levels in the upper 500 meters) Forgings: ERA40 heat fluxes and winds CORE freshwater fluxes (SST and SSS restored to Reynolds SST and Levitus SSS using bulk formulas) CO2 scenario: Pre-industrial run keeping atmospheric CO2 constant at 278 ppm Anthropogenic run using the observed atmospheric CO2 values
II. Model-Data comparison: anthropogenic carbon DATA/MODEL: CANT ANTHROPOGENIC CARBON DISTRIBUTION (µmol/kg) DATA (late 1990’s) MODEL (in 2000) 500m 60 40 30 30 20 20 40
II. Model-Data comparison: carbon changes Anthropogenic Carbon change (µmol/kg) DATA MODEL DATA/MODEL changes (1) 12 10 8 6 4 3 Total Carbon change (µmol/kg) DATA MODEL 8 10 8 4 6 2 0 -2
II. Model-Data comparison: carbon changes Natural Carbon change (µmol/kg) MODEL (CO2atm = 278ppm) DATA (DTCO2-DCant) DATA/MODEL nat C (1) -2 2 0 -4 -2 -4 -2 -5 • When the anthropogenic signal is removed, the remaining pattern shows • a decrease in upper CDW, • but no significant change in sub-surface Antarctic waters • - a smaller decrease in SAMW, • but no significant change in STMW
II. Model-Data comparison: carbon changes Natural Carbon change (µmol/kg) MODEL (CO2atm = 278ppm) DATA (DTCO2-DCant) DATA/MODEL nat C (2) -2 2 0 -4 -2 -4 -2 -5 1000m
Summary Summary I. OBSERVATIONS Mode Waters transport anthropogenic CO2 from the surface down to ~1000m STMW: The invasion of anthropogenic CO2 explains most of the TCO2 increase. TCO2 increased by ~8 µmol/kg over 15 year SAMW: The invasion of anthropogenic CO2 is compensated for by an equal decrease in natural carbon. No change in TCO2. South of the Polar Front: no significant change in anthropogenic carbon upper CDW: TCO2 decreased by 9 (± 6) µmol/kg II. MODEL The observed changes are reasonably well reproduced in the model The model suggests that the decrease in ocean carbon observed at mid-depths (~500-2000m), is a large scale feature representative of other regions in the South Atlantic and South Pacific
Perspectives Ongoing/future work What are the mechanisms driving the change in natural carbon in the model? Would it be coherent with observations? Perspectives (2) CARINA+GLODAP merged dataset: Southern Indian sector
XXXXXX END XXXXXX To be continued…
Perspectives DCTOT +48 GtC DCTOT +21 GtC DCANTH +46 GtC DCANTH +25 GtC DCNAT +2 GtC DCNAT -4 GtC DCTOT +3 GtC DCTOT +24 GtC DCANTH +18 GtC DCANTH +3 GtC DCNAT -15 GtC DCNAT +21 GtC Changes in ocean carbon inventories (Pg of Carbon) Perspectives (1) Full water column 0-500m 500m-2000m below 2000m
Scientific context CLIMATE CO2 Total Carbon Total Carbon OCEAN PROCESSES (photosynthesis, dynamics, ...) OCEANIC CARBON CYCLE Scientific context Anthropogenic CO2 CO2 emissions
Water masses I. Observations: water masses Mean position of hydrological fronts after Belkin and Gordon (1996) Potential temperature [°C] AASW STSW WW STMW Upper CDW SAMW
Mode waters (1) I. Observations: Mode waters Mode Waters distribution after Hanawa and Talley, 2000) Subtropical Mode Waters Subpolar MW STMW Eastern Subtropical Mode Waters Eastern STMW STMW SAMW
Mode waters (2) I. Observations: Mode Waters Mode Waters distribution after Hanawa and Talley, 2000) Subpolar MW STMW Eastern STMW STMW SAMW Anthropogenic Carbon distribution [µmol/kg] WW STMW Upper CDW SAMW
Cant 500m (1) Anthropogenic Carbon in Mode Waters Anthropogenic carbon distribution at 500m in the late 1990’s [µmol/kg] Anthropogenic carbon calculated from observations (TCO2, TA, O2 and conservative tracers) Observations : WOCE (1995-1996) OISO 1 to 3 (1998) 500m Large accumulation of anthropogenic carbon at mid-latitudes (20-40°S) in recently formed Mode Waters
Cant 500m (2) Anthropogenic Carbon in Mode Waters Anthropogenic carbon distribution at 500m in the late 1990’s [µmol/kg] Anthropogenic carbon calculated from observations (TCO2, TA, O2 and conservative tracers) Observations : INDIGO 1 (1985) WOCE (1995-1996) OISO 1 to 3 (1998) 500m Comparison of recent observations (1998-2001) with historical measurements (1985) to evaluate the decadal change in ocean carbon
Total Carbon and Anthropogenic Carbon distributions Anthropogenic Carbon distribution [µmol/kg] WW STMW SAMW Upper CDW Total carbon distribution [µmol/kg] AASW WW STSW STMW SAMW Upper CDW Cant TCO2 distributions
I. Observations Anthropogenic carbon distribution [µmol/kg] AASW WW STSW Direct method STMW SAMW Upper CDW 50°S 35°S Total Carbon changes (µmol/kg) Total Carbon changes (µmol/kg) AASW WW STSW No change +15±5 µmol/kg No change +6±3 µmol/kg STMW -5±4 µmol/kg no change Upper CDW SAMW
I. Observation : carbon changes Total Carbon (µmol/kg) Total Carbon (µmol/kg) AASW WW STSW No change +15±5 µmol/kg No change +6±3 µmol/kg STMW -5±4 µmol/kg no change Upper CDW SAMW 50°S 35°S TCO2 changes (2) Anthropogenic Carbon change over 15 years [µmol/kg] WW STMW SAMW Upper CDW Physical and biogeochemical tracers (S, T, O2, Nut, Alk) are used to remove the effect of ocean variability (dynamics, biological activity).
Carbon changes : eMLR method Extended Multi-Linear Regression (eMLR) technique Friis et al. (2005, DSR.I) eMLR method Multi-Linear regressions of Total Carbon against selected tracers (A, B, C…) determined using observations collected at time t1 and t2. t1 : INDIGO (1985) Total Carbon (t1) = a1.A1 + b1.B1 + c1.C1 + d1 t2 : OISO (1998-2001) Total Carbon (t2) = a2.A2 + b2.B2 + c2.C2 + d2 Coefficients determined for time t1 and t2 are then applied to the same set of tracers to evaluate the change in Total Carbon between t1 and t2: Total Carbon change (t2 - t1) = (a2-a1).A2 + (b2-b1).B2 + (c2-c1).C2 + (d2-d1)
I. Observation : carbon changes eMLR method 1: physical and BGC tracers DTCO2 = eMRL (S, T, O2, Nut, Alk) eMLR methods 1 & 2 Anthropogenic Carbon changes (DCanth) [µmol/kg] WW STMW SAMW Upper CDW eMLR method 2: using only conservative tracers DTCO2 = eMRL (S, T, NO) Total Carbon changes (DTCO2) [µmol/kg] WW STMW SAMW Upper CDW
I. Observation : carbon changes Difference between the 2 results: DCT (eMLR1) – DCanth (eMLR2) ‘Natural’ C changes Natural Carbon change (DCnat) [µmol/kg] WW STMW SAMW Upper CDW When the anthropogenic signal is removed from the total carbon change, the remaining pattern shows - a large decrease in Upper Circumpolar Deep Water (6-12 µmol/kg), but no change in sub-surface Antarctic waters - a small decrease in Subantarctic Mode Waters (4-6 µmol/kg), but no significant change in STMW (small increase in newly formed STMW?)
II. Model-Data comparison: carbon changes Anthropogenic Carbon change (µmol/kg) DATA MODEL DATA/MODEL changes (2) 12 10 8 6 2 4 3 Total Carbon change (µmol/kg) DATA MODEL
DATA / MODEL : Total and Anthropogenic Carbon changes Total Carbon change (µmol/kg) DATA MODEL DATA/MODEL OLD: CANT 11 9 -5 7 -3 5 3 Anthropogenic Carbon change (µmol/kg) DATA MODEL 11 9 5 3 7
DATA / MODEL : ‘Natural’ Carbon changes Natural Carbon change (µmol/kg) MODEL (CO2atm = 278ppm) DATA (DTCO2-DCant) DATA/MODEL OLD: Nat C -1 -11 -9 -7 -3 -5 -7 0 MODEL: Natural Carbon changes at 700m [µmol/kg] • Carbon decrease associated with • Warming • Oxygen increase • Nutrients decrease 700m
MODEL : Large scale changes Natural Carbon changes at 700m [µmol/kg] • Carbon decrease associated with • Warming • Oxygen increase • Nutrients decrease MODEL OLD: large scale Nitrate changes at 700m [µmol/kg] • Carbon decrease associated with • Nutrients decrease • Oxygen increase Oxygen changes at 700m [µmol/kg] 700m