Download
1 / 33
330 likes | 501 Vues
CHAPTER 3 Analysis of Financial Statements. Ratio Analysis Du Pont system Limitations of ratio analysis Qualitative factors. 2006E 85,632 878,000 1,716,480 2,680,112 1,197,160 380,120 817,040 3,497,152. 2005 7,282 632,160 1,287,360 1,926,802 1,202,950

E N D
CHAPTER 3Analysis of Financial Statements Ratio Analysis Du Pont system Limitations of ratio analysis Qualitative factors
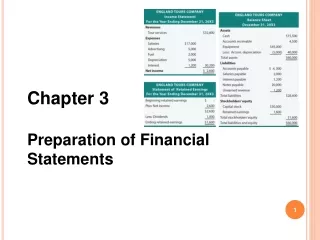
2006E 85,632 878,000 1,716,480 2,680,112 1,197,160 380,120 817,040 3,497,152 2005 7,282 632,160 1,287,360 1,926,802 1,202,950 263,160 939,790 2,866,592 D’Fizi’sBalance Sheet: Assets Cash A/R Inventories Total CA Gross FA Less: Dep. Net FA Total Assets
Balance sheet: Liabilities and Equity Accts payable Notes payable Accruals Total CL Long-term debt Common stock Retained earnings Total Equity Total L & E 2006E 436,800 300,000 408,000 1,144,800 400,000 1,721,176 231,176 1,952,352 3,497,152 2005 524,160 636,808 489,600 1,650,568 723,432 460,000 32,592 492,592 2,866,592
Income statement Sales COGS Other expenses EBITDA Depr. & Amort. EBIT Interest Exp. EBT Taxes Net income 2006E 7,035,600 5,875,992 550,000 609,608 116,960 492,648 70,008 422,640 169,056 253,584 2005 6,034,000 5,528,000 519,988 (13,988) 116,960 (130,948) 136,012 (266,960) (106,784) (160,176)
2006E 250,000 $1.014 $0.220 $12.17 $40,000 2005 100,000 -$1.602 $0.110 $2.25 $40,000 Other data No. of shares EPS DPS Stock price Lease pmts
Why are ratios useful? • Ratios standardize numbers and facilitate comparisons. • Ratios are used to highlight weaknesses and strengths. • Ratio comparisons should be made through time and with competitors • Trend analysis • Peer (or Industry) analysis
What are the 5 major categories of ratios, and what questions do they answer? 1) Liquidity: Can we make required payments? a) Current Ratio = Current Asset Current Liability b) Quick or Acid Test Ratio = Current Asset – Inventories Current Liabilities
2) Asset management: right amount of assets vs. sales? a) Inventory Turnover Ratio = Sales Inventories b) Days Sales Outstanding = Receivables (DSO) Avg sales per day = Receivables Annual sales/365days
c) Fixed Assets Turnover Ratio = Sales Net Fixed Assets d) Total Assets Turnover Ratio = Sales Tot. Assets
3) Debt management: Right mix of debt and equity? a) Tot. debt to Tot. assets = Tot. debt or Debt Ratio Tot. assets b) Times-interest-earned (TIE) = EBIT Interest charges c) Debt to Equity = L/term debt Equity
4) Profitability: Do sales prices exceed unit costs & are sales high enough as reflected in PM, ROE & ROA? a) Profit margin on sales = Net income = ____% Sales b) Ret on Assets (ROA) = Net income = ____% Tot. Assets c) Ret on Equity (ROE) = Net income = ____% Common Equity
5) Market value: Do investors like what they see as reflected in P/E and M/B ratios? a) $ to earnings (P/E) = $ per share Earnings per share c) Market to book (M/B) = Mkt $ per share Book value per share
Calculate D’fizi’s forecasted current ratio and quick ratio for 2006. Current ratio = Quick ratio =
Comments on liquidity ratios Comments:
What is the inventory turnover vs. the industry average? Inv. turnover =
Comments on Inventory Turnover • Inventory turnover is ____________ _____________________________
DSO is the average number of days after making a sale before receiving cash. DSO = _______? DSO = = ________days
Appraisal of DSO Comments __________________________
Fixed assets and total assets turnover ratios vs. the industry average FA turnover = ______ = _____x TA turnover = __________ = _____x
Evaluating the FA turnover and TA turnover ratios Comments? FA TO ________________________ TA TO _________________________
Calculate the debt ratio and times-interest-earned? Debt ratio = ________________ = _____% TIE = ________ = ____x
How do the debt management ratios compare with industry averages? D/A and TIE are ___________________
Profitability ratios: Profit margin? Profit margin = __________ = ______%
Appraising profitability with the profit margin. Comments? Profit margin _________________________
Profitability ratios: Return on assets and Return on equity ROA = ________ = ____% ROE = ________ = ____%
Appraising profitability with the return on assets and return on equity Comments? ________________________________
Calculate the Price/Earnings and Market/Book ratios. P/E = _______ = ____x M/B = ____________ = ________x
Analyzing the market value ratios • P/E: How much_____________. • M/B: How much________________. • For each ratio, the higher the number, the ______. • P/E and M/B are high if ROE is ___and risk is ____.
The Du Pont system • Focuses on : - expense control (PM), - asset utilization (TA TO), and - debt utilization (Equity multiplier.)
Potential problems and limitations of ratio analysis • Comparison with industry averages - difficult for a conglomerate firm that operates in many different divisions. • “Average” performance is not necessarily good, perhaps the firm should aim higher. • Seasonal factors can distort ratios. • “Window dressing” techniques can make statements and ratios look better.
More issues regarding ratios • Different operating and accounting practices can distort comparisons. • Sometimes it is hard to tell if a ratio is “good” or “bad”. • Difficult to tell whether a company is, on balance, in strong or weak position.
Qualitative factors • Are the firm’s revenues tied to one key customer, product, or supplier? • What percentage of the firm’s business is generated overseas? • Competition • Future prospects • Legal and regulatory environment