
Uploaded by
channing-wells
10 SLIDES
238 VUES
100LIKES
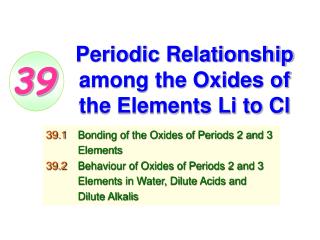
Relationship of Elements
DESCRIPTION
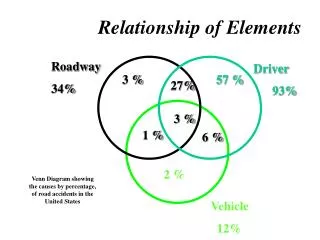
Roadway 34%. Driver 93%. 3 %. 57 %. 27%. 3 %. 1 %. 6 %. 2 %. Vehicle 12%. Relationship of Elements. Venn Diagram showing the causes by percentage, of road accidents in the United States.
Download
1 / 10
Télécharger la présentation 
Relationship of Elements
An Image/Link below is provided (as is) to download presentation
Download Policy: Content on the Website is provided to you AS IS for your information and personal use and may not be sold / licensed / shared on other websites without getting consent from its author.
Content is provided to you AS IS for your information and personal use only.
Download presentation by click this link.
While downloading, if for some reason you are not able to download a presentation, the publisher may have deleted the file from their server.
During download, if you can't get a presentation, the file might be deleted by the publisher.
E N D
Presentation Transcript
Roadway 34% Driver 93% 3 % 57 % 27% 3 % 1 % 6 % 2 % Vehicle 12% Relationship of Elements Venn Diagram showing the causes by percentage, of road accidents in the United States
Left four segments are supply disruptions - right three segments are demand driven.


More Related
Audio
Live Player