Download
1 / 1
10 likes | 127 Vues
Solar Weather and Tropical Cyclone Activity. Results. Abstract

E N D
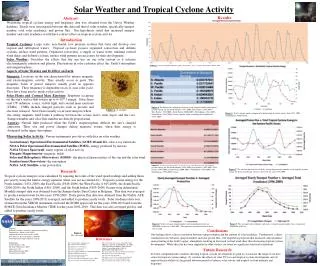
Solar Weather and Tropical Cyclone Activity Results Abstract Worldwide tropical cyclone energy and frequency data was obtained from the Unisys Weather database. Trends were investigated between this data and that of solar weather, specifically sunspot number, total solar irradiance, and proton flux. Our hypothesis stated that increased sunspot number and solar irradiance would have a direct effect on tropical cyclone activity. • Introduction • Tropical Cyclones: Large scale, non-frontal, low pressure systems that form and develop over tropical and subtropical waters. Tropical cyclones possess organized convection and definite cyclonic surface wind patterns. Organized convection, a supply of warm water, minimal vertical wind shear, and definite cyclonic surface wind patterns are necessary for their development. • Solar Weather: Describes the effects that the sun has on our solar system as it releases electromagnetic radiation and plasma. Fluctuations in solar radiation effect the Earth’s atmosphere and magnetosphere. • Aspects of Solar Weather and Its Effect on Earth Figure 3: Yearly Sunspot Number from 1850-2009. The 11-year solar cycle can be seen. Sunspots:Locations on the sun characterized by intense magnetic and electromagnetic activity. They usually occur in pairs. The magnetic fields of paired sunspots usually point in opposite directions. Their frequency is dependent on an 11-year solar cycle. They have been used to predict solar activity. Solar Flares and Coronal Mass Ejections: Eruptions occurring on the sun’s surface that release up to 6×1025 J energy. Solar flares emit UV radiation, x-rays, visible light, and coronal mass ejections (CMEs). CMEs include charged particles such as protons and electrons released. Solar flares usually occur near sunspots where Figure 4: The numerical correlations between yearly sunspot number and tropical cyclone energy for the North Atlantic (1851-2009), East Pacific (1949-2009), West Pacific (1945-2009), South Pacific (2000-2009), North Indian (1981-2009), South Indian (1983-2009) Oceans, and the world, excluding the South Pacific (1983-2009). Figure 1: A sunspot Figure 5: Yearly sunspot number compared to global tropical cyclone energy from 1983-2009, excluding the South Pacific. the strong magnetic field forms a pathway between the corona (sun’s outer layer) and the core.Sunspot number and solar flare number are directly proportional. Auroras: Natural light produced when the Earth’s magnetosphere deflects the sun’s charged emissions. Their size and power changes during magnetic storms, when their energy is dissipated in the upper atmosphere. Measuring Solar Activity:Various instruments provide us with data on solar weather. Geostationary Operational Environmental Satellites (GOES 10 and 12)- solar x-ray emissions NOAA Polar Operational Environmental Satellite (POES)- energy produced by auroras NASA Ulysses Spacecraft- many aspects of solar activity Fluxgate Magnetometer- magnetic fields Solar and Heliospheric Observatory (SOHO)- the physical characteristics of the sun and the solar wind Sondrestrum Observatory- the ionosphere NASA ACE Satellite- solar proton flux Figure 6: Numerical correlations between yearly solar proton flux and tropical cyclone energy for the North Atlantic (1998-2009), East Pacific (1998-2009), West Pacific (1998-2009), South Pacific (2000-2009), North Indian (1998-2009), and South Indian (1998-2009) Oceans. Figure 7: The relationship between the daily averaged proton flux and the yearly tropical cyclone energy for the Eastern Pacific Ocean is shown for the years 1998-2009. Research Tropical cyclone energies were calculated by squaring the totals of the wind speed readings and adding them per year by using the kinetic energy equation (mass was not accounted for). Tropical cyclone energy for the North Atlantic (1851-2009), the East Pacific (1949-2009), the West Pacific (1945-2009), the South Pacific (2000-2009), the North Indian (1981-2009), and the South Indian (1983-2009) Oceans were determined. Monthly sunspot data was obtained from the Sunspot Index Data Center in Belgium. This data was averaged to produce annual totals for the years 1850-2009. Daily proton flux data was obtained from the NASA ACE Satellite for the years 1998-2010, averaged, and added to produce yearly totals. Solar irradiance data was obtained from the VIRGO instrument on-board the SOHO spacecraft for the years 1996-2010 and from the SORCE-Total Irradiance Monitor (TIM) for the years 2003-2010. This data was also averaged per day, and added to produce yearly totals. Figure 8: Yearly averaged sunspot number and averaged proton flux are illustrated for the years 1998-2009 . The numerical correlation between these two is 0.766. Figure 9: The averaged solar irradiance and yearly averaged sunspot number have a numerical correlation of 0.986. Sponsors: National Aeronautics and Space Administration (NASA) Goddard Space Flight Center (GSFC) Goddard Institute for Space Studies (GISS) New York City Research Initiative (NYCRI) CUNY Queensborough Community College Contributors: Dr. Paul Marchese (PI) Mr. Daniel Mezzafonte (HST) Adnan Aziz (UG) Michael Hirschberger (HSS) Alana Menendez (HSS) Conclusions Our findings show a direct correlation between sunspot number and the amount of solar irradiance. Furthermore, a direct correlation exists between sunspot number and solar proton flux. Our hypothesis proposed that increased solar irradiance causes heating in the Earth’s upper atmosphere resulting in increased vertical wind shear thus decreasing tropical cyclone development. While this idea has been supported in other studies, we found no significant statistical correlations. Future Research To better comprehend the variables affecting tropical cyclone development we plan to (1) increase the range of our data series for tropical cyclone energy, (2) correlate the effects of solar UV rays and tropical cyclone development, and (3) explore the possibility of a lag period between periods of intense solar activity and tropical cyclone intensity and frequency. Figure 2: The solar wind References http://weather.unisys.com/hurricane/ http://solarscience.msfc.nasa.gov/SolarWind.shtml Kopp, G.; Lawrence, G and Rottman, G. (2005). "The Total Irradiance Monitor (TIM): Science Results". Solar Physics20: 129–139. doi:10.1007/s11207-005-7433-9 http://csep10.phys.utk.edu/astr162/lect/sun/flares.html http://curious.astro.cornell.edu/sun.php http://www.ias.u-psud.fr/virgo/ http://lasp.colorado.edu/sorce/instruments/tim.htm http://www.aoml.noaa.gov/hrd/tcfaq/A15.html http://www.crh.noaa.gov/fsd/astro/sunspots.php http://odin.gi.alaska.edu/FAQ/ http://www.oso.noaa.gov/goes/ http://www.oso.noaa.gov/poes/ http://ulysses.jpl.nasa.gov/ http://www.earthsci.unimelb.edu.au/ES304/MODULES/MAG/NOTES/fluxgate.html http://sohowww.nascom.nasa.gov/ http://isr.sri.com/about.html http://www.srl.caltech.edu/ACE/ace_mission.html http://www.aoml.noaa.gov/hrd/tcfaq/A1.html