Download
1 / 103
1.03k likes | 1.18k Vues
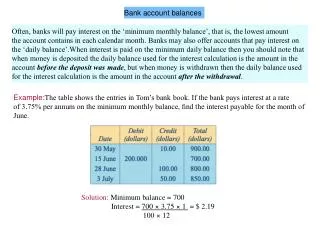
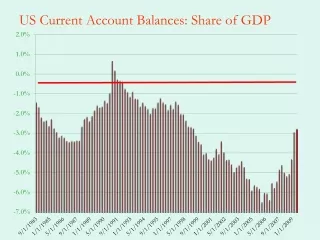
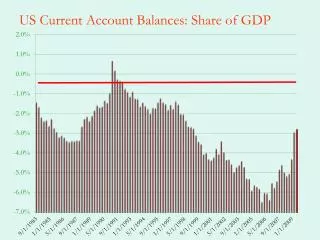
US Current Account Balances: Share of GDP. Sustainability. What does it mean to say that the CA is sustainable? Can the economy continue to borrow? When will it be cut off from further borrowing? Start with the current account expression: (note that i.e, net foreign assets)

E N D
Sustainability • What does it mean to say that the CA is sustainable? • Can the economy continue to borrow? • When will it be cut off from further borrowing? • Start with the current account expression: • (note that i.e, net foreign assets) • Which we can write as, • And thus
Substitution • Thus, • Now use this in the CA expression to eliminate • And repeat the process:
Result • If we keep doing this indefinitely, we obtain: • This should look familiar • The first term on RHS is PV of net imports • Second term is PV of NFA some time very far in the future • Call this the terminal value of NFA. Let’s examine this first • If finite horizon • PV of terminal assets = 0 • If infinite horizon then let T go to infinity, • Why is this our terminal condition Why does it make sense?
Terminal Value of NFA • If we are running a Ponzi game • We never pay back our debts – free lunch • If we are forgoing some utility • => we are gifting foreigners, not optimal • Hence, we must have • So, our intertemporal constraint must be:
Intertemporal constraint • This means that, • The economy’s net debt today = PV of future trade surpluses • So key to sustainability is economy’s ability to generate future surpluses • Is it rational to believe that we can earn sufficient future surpluses? • Key is thus expectations of future spending and income • Not much of a criteria • Can’t we say more than this?
Second try at criteria • When is debt non-increasing? • That is, when does Debt/GDP not grow? • We cannot have a steady state with exploding debt • Why is this important? • Let the growth rate be defined by • Start with • Then we can show that the change in NFA/GDP is,
How do we get this • Start with and divide by Yt+1 • Then,
Implication • Why is this expression important? • Decompose the growth in debt ratio to: • Primary component – the trade balance • Feedback component – the weight of the past debt • If r > g then burden of past debt is growing • If r < g then we can have a party today and the burden still decreases over time • Dynamic inefficiency • So debt is sustainable if debt ratio is not growing
Sustainability • What does this imply? • If we have negative NFA, then r > g implies it will grow • Faster growth means it will decrease • Or, if we have positive trade balances debt will fall • Suppose, r = .05 and g = .03 • If tb gradually goes to zero we get debt crisis • We need tb to go to 1.5% of GDP to escape • If r = .06 and g = .03things are worse • If r = .08 and g = .03we are in real trouble • Problem: r depends on kf
Simulations (r = .06, g = .03) TB declines at constant rate
Simulations (r = .08, g = .03) TB declines at constant rate
NFA and Ability to Repay • Notice that even if NFA gets more negative what matters is ability to repay • For US, net wealth has been rising relative to net debt • Foreign debt is still small relative to total US debt • In industrialized countries foreigners cannot be treated differently from residents • So US is better credit risk than one might fear
Valuation • You might think of , i.e., as the sum of all past current accounts • Think of a bathtub. Level of water is the sum of all the water that has ever been poured in, minus all the water that ever drained out • Would be true if we lived in one-good economy • But NFA made up of many assets and liabilities, and their relative prices change over time • This => US indebtedness can change even without CA reversal
Valuation Effects • We need to add valuation effects • NFA may differ from cumulative current accounts • If US earns positive net foreign income this adds to our consumption possibilities • Where do they come from? • Differences in rates of return • Capital gains and losses on foreign assets • Interest income is reported capital gains are not realized • Postpone why, and first adjust our analysis
NFA and Valuation • Suppose US stock market rises • Then value of foreign holdings of US assets rises • So NFA decreases • But has US ability to finance debt fallen? Probably not, if the stock market rose due to higher productivity etc. • Example, Finland and Nokia • Nokia widely held by foreigners was a huge share of Finnish wealth • When Nokia’s stock price surged, Finnish NFA approached minus 170% of GDP, when the price fell NFA recovered
Adjusting for Valuation • Separate out income on NFA in the CA expression • We want to express everything in ratios again • or
Capital Gains • We need to do something about the term, KG • Suppose they are proportional to assets and liabilities • Then, • If we let real returns be then,
Valuation • Now we know that • So, • or
Implications • The first and last term are familiar from before • The middle term is the valuation term • If obviously no valuation effect • Excess return on assets allows NFA to grow even when GDP growing slow or tb is too small • If we earn excess returns the scale of NFA matters • Since NFA for US is roughly 25% of GDP this is big • How does it impact sustainability?
Role of Size • Size of net debt matters • We know that net interest income is • For this to be positive we require • So,
Implications • We are assuming that so • Let’s suppose that and • Thus, • What about RHS? In US, L is about equal to Y • So is approximately equal to -.26 • So the condition for positive net income is satisfied, since • But what if net debt rises to -.35? • Or if rA falls to .05?
Why was this calculation interesting? • We showed that even though US NFA < 0, it is still possible to earn positive interest income • This is possible because returns on assets we hold are greater than returns paid on our liabilities • But it also requires that liabilities not be too much greater than assets • Why this is the case is interesting.
Valuation Effect: Causes • What causes this? • Imperfect substitutability • If assets and liabilities were perfect substitutes, returns would be equalized • Risk could be a factor • Exorbitant privilege • We borrow in our own currency • Liability mismatch • US is like a bank, borrow short lend long • From Central Banker to venture capitalist • Share of portfolio in risk assets has risen • But liquidity mismatch can be trouble • Future Triffin Problem?
Dark Matter • In 1980 NFA of US$365bn and net foreign investment income of US$30bn. • Cumulative current account deficits between 1980 and 2004 were US$4.5tn, but net income relatively constant • Yet the US net foreign factor income in 2004 was still US$30bn • Seems paradoxical • Especially if we assume that the net foreign investment income data is to be trusted more than trade balance and net foreign assets data
Dark Matter • HS assume that the latter miss systematic income streams • Global liquidity services • Insurance services • Knowledge services • These do not show up in historical capital flow data, or in market value data • Why? went unrecorded, is that these services were bundled with financial instruments: • US currency, US sovereign debt and US-originated FDI. • But once abroad they produce income streams • US has been so good at exporting these services that conventional current account balance data is irrelevant • Notice this is opposite to the savings glut type or investment boom hypothesis
Dark Matter • Suppose that the $30 billion in net income is real • Discount this at 5% • Equals $600 billion • Since, measured NFA = $-2.5 trillion, HS conclude that there must be missing $3.1 trillion in assets • This is Dark Matter • Curious that H-S apply discount factor to net rather than gross income • Gross income in 2004 was $376 billion, so by their procedure, gross assets = $7.52 trillion, less than measured official gross assets of $10 trillion • Perhaps there is dark anti-matter! • Since foreign assets in US generated $340 billion, by H-S this implies $6.8 trillion, so dark anti-matter for foreign assets is $5.7 trillion!
Dark Matter: Assessment • Perhaps FDI income is mis-measured, but why should we trust net income measures more than asset trade balance data? • Why is the mis-measurement one way? • US has had lots of inward FDI too • Does the historical cost of foreign direct investment in the US understate the fair value of the assets it created by less than the historical cost of outward US direct investment abroad understates the fair value of the assets thus created? • Why are receipts always larger than liabilities? • Dark matter or cold fusion? • Seems pretty clear that the paradox is going away • Implies adjustment will be necessary • Even less exotic theories justifying massive capital inflows seem problematic in hindsight
Valuation Effect • This does not mean that the valuation effect is irrelevant • Valuation effects do lessen the need for adjustment • Consider an unexpected 10% depreciation of the $ • Suppose that A/Y = .7, and that 85% is held in dollars • Assume all liabilities are in dollars • This implies a transfer of 5.9% (0.7*0.85*0.1) of GDP from the rest of the world to the US • This would more than cover the trade deficit. • But why would foreigners hold $ if they expect it to depreciate?
Real Exchange Rate • For adjustment to occur the real exchange rate must change • Why can’t an increase in r solve the problem? • Increases CA surpluses for all countries • A differential change in relative price is needed • Real exchange rate is the relative price of foreign goods relative to our goods • Big swings since 1973 • Not just volatile, but not mean-reverting
Real Exchange Rate • Define the real exchange rate as • It is the relative price of foreign goods • Nominal exchange rate is the relative price of monies • An appreciation of the real exchange rate thus means that we are more competitive • changes in Q will impact net exports, and hence, the current account. • If a current account deficit is to be reversed an appreciation of the real exchange rate may be one of the mechanisms of adjustment.
An Important Detour: PPP • Suppose all goods tradable and that US and Japan produce identical basket of goods • Then arbitrage, “LOP,” implies that dollar price of goods will be equal, net of transport costs, so • SP* = P • but this implies that Q = 1, and S = P/P* • So nominal exchange rate is driven by price differences • Or movements in the exchange rate are driven by relative inflation rates,
More PPP • Big Mac Index • Predicts • Euro depreciation, Rand appreciation, Yen appreciation • So not perfect, why? • Not all goods are tradable • Consumption baskets differ • Theory based on trade flows, ignores capital flows • Relative prices not independent of income • Why?
International Prices • International prices differ from domestic prices • International prices refers to common prices for the same goods • Differ from domestic because of the presence of non-traded goods • Haircuts are cheaper in poor countries • Leads to differences in the relative prices of tradable goods across countries • Differences can be significant • in 2004 Chinese per-capita income measured at market exchange rates was $1272, but at international prices it was $6200. At international prices China is the second largest economy in the world. Only about 7th at market exchange rates. • Japan, on the other hand had per-capita income of $37,600 at market prices, but at international prices it was only $31,400.
Simple Example • 2 countries (A and B), 2 goods (T and N) • Country B is richer • Identical preferences for simplicity • GDP at market prices in country A is • Assume market exchange rates cause • Ratio of GDP’s is in the figure • Notice that N is relatively more expensive in B
International Prices • Now use a common set of relative prices to value the consumption baskets • At common international prices the choices of A are more expensive. We have • People in poor countries spend more of their income on N because these are relatively cheaper