Remote Sensing Applications In Identifying Crop Infestation EES5053 Fall 2006 Meaghan Metzler December 5, 2006
Remote Sensing Applications In Identifying Crop Infestation EES5053 Fall 2006 Meaghan Metzler December 5, 2006. Outline. Background and Overall Objectives Method Description Data Used Results General Conclusions. Background.

Remote Sensing Applications In Identifying Crop Infestation EES5053 Fall 2006 Meaghan Metzler December 5, 2006
E N D
Presentation Transcript
Remote Sensing Applications In Identifying Crop Infestation EES5053 Fall 2006 Meaghan Metzler December 5, 2006
Outline • Background and Overall Objectives • Method Description • Data Used • Results • General Conclusions
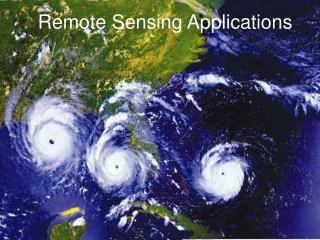
Background • Remote sensing is the process whereby information can be obtained from a source without actually coming in contact with it. • Popular applications include: water management, homeland security, disaster management, and agriculture efficiency.
Agricultural Efficiency • Crop stress associated with pest infestation is predominantly monitored through human visual inspection. • Pest infestation is not normally evenly distributed within a field. • Pesticide application is expensive and excessive application can cause resistance in pest species and damage to the environment
“RS techniques play an important role in timely detection and early warning of disease and insect pests” – El-Khatib et. al. Damage (or stress) can be identified by changes in the spectral signature of crop species. Overall Objective
Case-In-Point 1: RiceInfested with Sheath Blight • Location: Hazen City, Arkansas • Field size: 762m x 467m • Infestation: naturally infected with sheath blight, caused by Rhizoctonia solani
Methodology • Field was divided into 11 strips with 50 sampling sites for observing the severity of the disease infestation. • 3 indices used: • SHBDI = % infected tillers • SHBDH = height (cm) of sheath blight symptoms • TH = height (cm) of plant canopy above soil • Ground disease index (DI) = SHBDI *SHBDH / TH
Data Used • Airborne RS images (7/12, 7/24/, 8/04, and 8,17) • 4 bands ~ 450-540nm, 530-600nm, 610-680nm, and 780-1000nm. • Resolution: 1m • DN: 0-255
Results • The change of DI was proportional to that of the change of DN values; however, it was weak. • It was difficult to discriminate from healthy plants and those with only a light infestation. • Higher spatial resolution and spectral resolution is required to diagnose crop disease efficiently and accurately.
Case-In-Point 2: Rice Infested with Blast • Location: nursery field at Nattaf Research Station, Giza, Egypt • Field size: 70 faddans (one faddan = 1.038 acres) • Infestation: infected with bast, caused by Pyricularia oryzae
Methodology • Reading were taken from a spectroradiometer • “The reading were taken to measure simultaneous reflected radiance flux in four wavelength of LANDSAT Multispectral Scanner (MSS) band; 0.5-0.6μm, 0.6-0.7μm, 0.7-0.8μm, and 0.8-1.1μm” El-Khatib et. al. • Ratio Vegetation Index (RVI) and Normalized Difference Vegetation Index (NDVI) were calculated
Results • The most noticeable changes in the reflection occurred first in the NIR region. • In the primary stages of blast infestations there was a decrease in both the green and NIR bands.
Case-In-Point 3: Rio Red Grapefruit infested with Greasy Spot • Location: Texas A&M University-Kingsville Citrus Center in Weslaco, TX • Field Size: about 9.2 acres of grapefruit trees • Infection:Mycosphaerella citri
Methodology & Data Used • Airborne multispectral and hyperspectral images were taken in May 2004 • Multispectral • Cameras with NIR 845-857nm filter, red 625-635nm filter, and yellow-green 555nm-565nm filter. • 0.7m spatial resolution
Data Used cont’. • Hyperspectral • Pushbroom camera system • 128 spectral bands 457.2nm-921.7nm • Spectral resolution 3.63nm • Spatial resolution 1.3m
Results • The spatial resolution using the hyperspectral airborne camera system (1.3m) is rougher, it made individual trees no longer discernable from one another • With the increase in bands more detail could be recorded so there was more classes when unsupervised classification was done • Hyperspectral system more precisely determines the health condition of the trees
Importance of RS to Agriculture • Can be used to determine vegetation conditions more accurately • Saves time • Saves wear and tear on farming equipment • Saves money • Helps limit pesticide use
General Conclusions • By reviewing these experiments the similarities of each was that because satellite technology does not have very high spatial resolution needed that other methods must be implemented: such as airborne multispectral hyperspectral platforms, or handheld hyperspectral spectroradiometer • From these experiments baseline recordings of spectral characteristics can be recorded to validate future recordings from space-borne platforms.