
_________ Equi-TB Knowledge Programme
E N D
Presentation Transcript
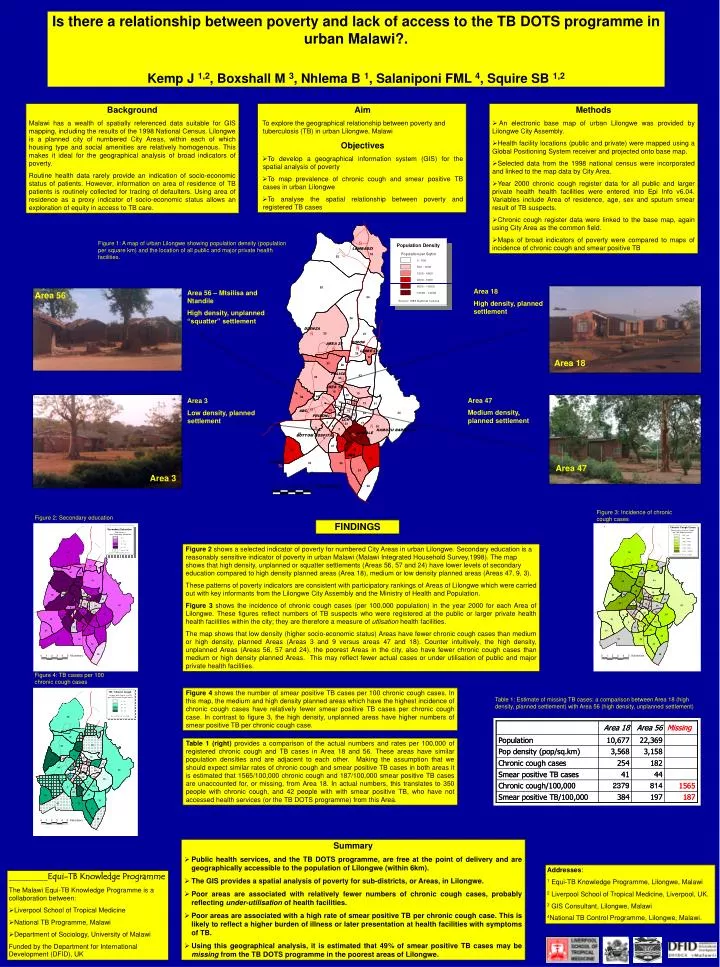
Figure 2: Secondary education Figure 3: Incidence of chronic cough cases Figure 4: TB cases per 100 chronic cough cases Table 1: Estimate of missing TB cases: a comparison between Area 18 (high density, planned settlement) with Area 56 (high density, unplanned settlement) Is there a relationship between poverty and lack of access to the TB DOTS programme in urban Malawi?. Kemp J 1,2, Boxshall M 3, Nhlema B 1, Salaniponi FML 4, Squire SB 1,2 Background Malawi has a wealth of spatially referenced data suitable for GIS mapping, including the results of the 1998 National Census. Lilongwe is a planned city of numbered City Areas, within each of which housing type and social amenities are relatively homogenous.This makes it ideal for the geographical analysis of broad indicators of poverty. Routine health data rarely provide an indication of socio-economic status of patients. However, information on area of residence of TB patients is routinely collected for tracing of defaulters. Using area of residence as a proxy indicator of socio-economic status allows an exploration of equity in access to TB care. • Aim • To explore the geographical relationship between poverty and tuberculosis (TB) in urban Lilongwe, Malawi Objectives • To develop a geographical information system (GIS) for the spatial analysis of poverty • To map prevalence of chronic cough and smear positive TB cases in urban Lilongwe • To analyse the spatial relationship between poverty and registered TB cases • Methods • An electronic base map of urban Lilongwe was provided by Lilongwe City Assembly. • Health facility locations (public and private) were mapped using a Global Positioning System receiver and projected onto base map. • Selected data from the 1998 national census were incorporated and linked to the map data by City Area. • Year 2000 chronic cough register data for all public and larger private health health facilities were entered into Epi Info v6.04. Variables include Area of residence, age, sex and sputum smear result of TB suspects. • Chronic cough register data were linked to the base map, again using City Area as the common field. • Maps of broad indicators of poverty were compared to maps of incidence of chronic cough and smear positive TB Figure 1: A map of urban Lilongwe showing population density (population per square km) and the location of all public and major private health facilities. Area 18 High density, planned settlement Area 56 – Mtsilisa and Ntandile High density, unplanned “squatter” settlement Area 56 Area 18 Area 47 Medium density, planned settlement Area 3 Low density, planned settlement Area 47 Area 3 FINDINGS Figure 2 shows a selected indicator of poverty for numbered City Areas in urban Lilongwe. Secondary education is a reasonably sensitive indicator of poverty in urban Malawi (Malawi Integrated Household Survey,1998). The map shows that high density, unplanned or squatter settlements (Areas 56, 57 and 24) have lower levels of secondary education compared to high density planned areas (Area 18), medium or low density planned areas (Areas 47, 9, 3). These patterns of poverty indicators are consistent with participatory rankings of Areas of Lilongwe which were carried out with key informants from the Lilongwe City Assembly and the Ministry of Health and Population. Figure 3 shows the incidence of chronic cough cases (per 100,000 population) in the year 2000 for each Area of Lilongwe. These figures reflect numbers of TB suspects who were registered at the public or larger private health health facilities within the city; they are therefore a measure of utlisation health facilities. The map shows that low density (higher socio-economic status) Areas have fewer chronic cough cases than medium or high density, planned Areas (Areas 3 and 9 versus areas 47 and 18). Counter intuitively, the high density, unplanned Areas (Areas 56, 57 and 24), the poorest Areas in the city, also have fewer chronic cough cases than medium or high density planned Areas. This may reflect fewer actual cases or under utilisation of public and major private health facilities. Figure 4 shows the number of smear positive TB cases per 100 chronic cough cases. In this map, the medium and high density planned areas which have the highest incidence of chronic cough cases have relatively fewer smear positive TB cases per chronic cough case. In contrast to figure 3, the high density, unplanned areas have higher numbers of smear positive TB per chronic cough case. Table 1 (right) provides a comparison of the actual numbers and rates per 100,000 of registered chronic cough and TB cases in Area 18 and 56. These areas have similar population densities and are adjacent to each other. Making the assumption that we should expect similar rates of chronic cough and smear positive TB cases in both areas it is estimated that 1565/100,000 chronic cough and 187/100,000 smear positive TB cases are unaccounted for, or missing, from Area 18. In actual numbers, this translates to 350 people with chronic cough, and 42 people with with smear positive TB, who have not accessed health services (or the TB DOTS programme) from this Area. • Summary • Public health services, and the TB DOTS programme, are free at the point of delivery and are geographically accessible to the population of Lilongwe (within 6km). • The GIS provides a spatial analysis of poverty for sub-districts, or Areas, in Lilongwe. • Poor areas are associated with relatively fewer numbers of chronic cough cases, probably reflecting under-utilisation of health facilities. • Poor areas are associated with a high rate of smear positive TB per chronic cough case. This is likely to reflect a higher burden of illness or later presentation at health facilities with symptoms of TB. • Using this geographical analysis, it is estimated that 49% of smear positive TB cases may be missing from the TB DOTS programme in the poorest areas of Lilongwe. Addresses: 1 Equi-TB Knowledge Programme, Lilongwe, Malawi 2 Liverpool School of Tropical Medicine, Liverpool, UK. 3 GIS Consultant, Lilongwe, Malawi 4National TB Control Programme, Lilongwe, Malawi. • _________Equi-TB Knowledge Programme • The Malawi Equi-TB Knowledge Programme is a collaboration between: • Liverpool School of Tropical Medicine • National TB Programme, Malawi • Department of Sociology, University of Malawi • Funded by the Department for International Development (DFID), UK