Correlation of Real-Time PCR Instruments Using MAQC Reference RNA Samples
This study evaluates the correlation between different real-time PCR instruments, specifically the ABI 7500, Stratagene Mx3000PTM, and BioRad iCycler iQ, using fold-change results and raw CT values from two MAQC reference RNA samples. Five replicate arrays were conducted for each sample on each instrument using appropriate RT2 SYBR Green master mixes. Results indicate strong correlations in measurement values across the instruments, as shown in panels A and B, with panel C presenting a cross-thermocycler comparison of the fold-change results.

Correlation of Real-Time PCR Instruments Using MAQC Reference RNA Samples
E N D
Presentation Transcript
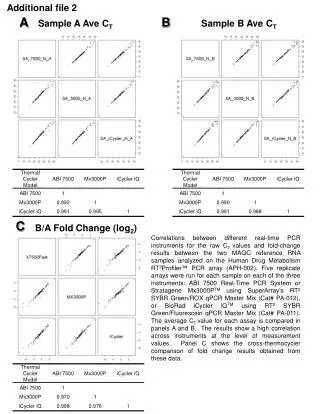
Additional file 2 A B Sample A Ave CT Sample B Ave CT C B/A Fold Change (log2) Correlations between different real-time PCR instruments for the raw CT values and fold-change results between the two MAQC reference RNA samples analyzed on the Human Drug Metabolism RT2Profiler™ PCR array (APH-002). Five replicate arrays were run for each sample on each of the three instruments: ABI 7500 Real-Time PCR System or Stratagene Mx3000PTM using SuperArray’s RT2 SYBR Green/ROX qPCR Master Mix (Cat# PA-012), or BioRad iCycler iQTM using RT2 SYBR Green/Fluorescein qPCR Master Mix (Cat# PA-011). The average CT value for each assay is compared in panels A and B. The results show a high correlation across instruments at the level of measurement values. Panel C shows the cross-thermocycler comparison of fold change results obtained from these data.