Example: Capital vs. Consumption
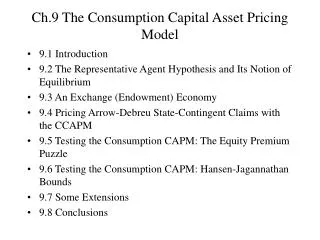
Production Possibilities Curve. Production Possibilities Curve – a curve that shows the maximum combinations of two outputs an economy can produce in a given period of time with its available resources and technology. Example: Capital vs. Consumption. K 1. Capital. Opportunity Cost. K 0.

Example: Capital vs. Consumption
E N D
Presentation Transcript
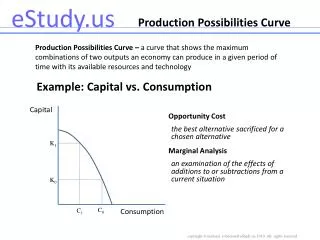
Production Possibilities Curve Production Possibilities Curve – a curve that shows the maximum combinations of two outputs an economy can produce in a given period of time with its available resources and technology Example: Capital vs. Consumption K1 Capital Opportunity Cost K0 the best alternative sacrificed for a chosen alternative Marginal Analysis C0 C1 an examination of the effects of additions to or subtractions from a current situation Consumption
Production Possibilities Curve Capital More Capital resulting in less Consumption Moving up or down the Production Possibilities Frontier illustrates to “Opportunity Cost” of using more Capital or Consumption K1 Unattainable K0 Consumption C0 C1 Economically efficient points (full employment at potential GDP) Inefficient point – all point inside the PPF are inefficient (unemployment) Unattainable at the moment more capital or improved capital more labor or improved labor
Increasing Opportunity Cost Capital In the range society more give up 120 unites of Capital to acquire 100 units of Consumption In the range society more give up 200 unites of Capital to acquire 100 units of Consumption 120 200 Consumption 100 100 As society products more of an asset it becomes increasingly difficult to acquire resources needed to make the asset As society transfers resources from one asset to another production efficiencies decline
Production Possibilities Curve Capital K1 K0 C0 Consumption C1 Acquiring more Capital has the opportunity cost of less Consumption which allows an economy to produce more Consumption and Capital items in the future. more capital or improved capital (technological change) more labor or improved labor (education)
Sources of Economics Growth Increase in Labor Supply Increase in Capital Assets Improvement in Labor Productivity (Education) • (Billions of 2005 Dollars)