Download
1 / 4
40 likes | 52 Vues
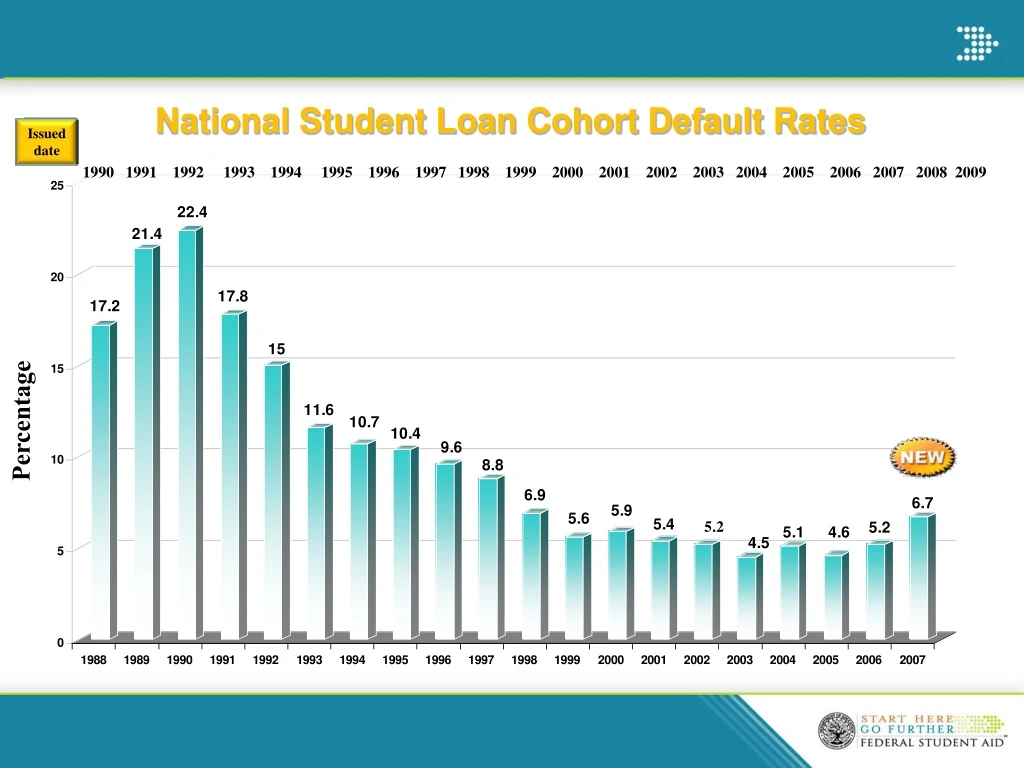
This analysis presents the default rates and sanctions issued to schools from 1990 to 2009. It includes the number of schools impacted, comparison of cohort default rates, and highlights the Institutional Default Rate Reduction Initiative.

E N D
National Student Loan Cohort Default Rates Issued date 1990 1991 1992 1993 1994 1995 1996 1997 1998 1999 2000 2001 2002 2003 2004 2005 2006 2007 2008 2009 Percentage Presenter Name(s)
Schools Subject to Sanctions Issued date 1993 1994 1995 1996 1997 1998 1999 2000 2001 2002 2003 2004 2005 2006 2007 2009 Number of Schools 2 Sanctions The school numbers are pre-appeal and include only schools impacted by the three years of 25% or greater sanction. A school can be on extended sanction and is therefore reflected in multiple year counts. Since 1991, 1,161 unique schools were sanctioned under the three years of 25% or greater sanction.
Comparison of FY 2007 Official Cohort Default Rates to Prior Two Official Calculations Institutional Default Rate Reduction Initiative Comparison of FY 2005, FY 2006, and FY 2007 Cohort Default Rates
Proprietary Other Schools Public and Private 4-yr


![[Name and affiliation of presenter(s)]](https://cdn3.slideserve.com/7027045/name-and-affiliation-of-presenter-s-dt.jpg)

![[Name and affiliation of presenter(s)]](https://cdn5.slideserve.com/9677486/name-and-affiliation-of-presenter-s-dt.jpg)