Transforming Services for the Poor: Pathways to Empowerment and Inclusion
330 likes | 357 Vues
This report explores how services can be improved for poor people by empowering them to monitor providers, advocate for change, and strengthening incentives for service providers. It addresses the challenges in public spending, service quality, and highlights successful examples of service improvement. The report emphasizes the importance of human development in achieving global goals and suggests strategies for scaling up successful initiatives.

Transforming Services for the Poor: Pathways to Empowerment and Inclusion
E N D
Presentation Transcript
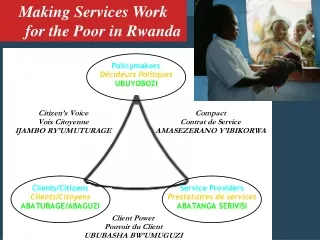
Making Services Work for Poor People World Development Report 2004 (Green Cover Draft) Shanta Devarajan
Messages • Services are failing poor people. • But they can work. How? • By empowering poor people to • Monitor and discipline service providers • Raise their voice in policymaking • By strengthening incentives for service providers to serve the poor
Universal Primary Education Why focus on human development?MDGs—Global Aggregates Eradicate Poverty & Hunger
Why focus human development?MDGs—Global Aggregates Promote Gender Equality Reduce Child Mortality Ratio of girls to boys in primary and secondary school (%)
Poorest quintile Richest quintile Outcomes are worse for poor peopleCumulative deaths per 1000 births Source: Analysis of Demographic and Health Survey data
Richest quintile Poorest quintile Outcomes are worse for poor peoplePercent aged 15 to 19 completing each grade or higher Source: Analysis of Demographic and Health Survey data
How are services failing poor people? • Public spending usually benefits the rich, not the poor
Percent to richest quintile Percent to poorest quintile Expenditure incidence Health Education Source: Compiled from various sources
Richest quintile Average Poorest quintile Use of an improved drinking water source Source: Analysis of Demographic and Health Survey data
How are services failing poor people? • Public spending usually benefits the rich, not the poor • Money fails to reach frontline service providers • In Uganda, only 13% of non-wage recurrent spending on primary education reached primary schools
How are services failing poor people? • Public spending benefits the rich more than the poor • Money fails to reach frontline service providers • Service quality is low for poor people
Examples of low service quality • Bangladesh: Absenteeism rates for doctors in primary health care centers: 74%. • Zimbabwe: 13% of respondents gave as a reason for not delivering babies in public facilities that “nurses hit mothers during delivery”. • Guinea: 70% of government drugs disappeared. • Costa Rica: absenteeism rate is 30% in public health facilities.
But services can work • Infant mortality and malnutrition reduced in Ceará, Brazil • Citywide services in Johannesburg, South Africa reformed • Cash transfers to households in Mexico increased enrollment, lowered illness cases • Citizen report cards in Bangalore, India • More money reached primary schools in Uganda
Mexico’s PRONASOL, 1989-94 • Large social assistance program (1.2% of GDP) • Water, sanitation, electricity and education construction to poor communities • Limited poverty impact • Reduced poverty by 3% • If better targeted, could have reduced it by 64%
Mexico : average per capita PRONASOL expenditure according to party in muncipal government 450 400 350 300 250 Real pesos of 1995 per capita 200 150 100 50 0 1989 1990 1991 1992 1993 1994 PRI : Institutional Revolutionary Party PAN : National Action Party PRD : Party of the Democratic Revolution Other
Policymaker-Provider:Contracting NGOs in Cambodia • Contracting out (CO): NGO can hire and fire, transfer staff, set wages, procure drugs, etc. • Contracting in (CI): NGO manages district, cannot hire and fire (but can transfer staff), $0.25 per capita budget supplement • Control/Comparison (CC): Services run by government 12 districts randomly assigned to CC, CI or CO
Utilization of Facilities by Poor People Sick in last month, %
FSSAP Bangladesh • Criteria: • Attendance in school • Passing grade • Unmarried • Girls to receive scholarship deposited to account set up in her name • School to receive support based on # of girls
What we can do to scale up • Tailor service delivery arrangements to service characteristics and country circumstances • Expand information
What we can do to scale up • Donors • Harmonize • Integrate aid in recipient’s budget system • Finance impact evaluation of service delivery innovations ($300 million a year)