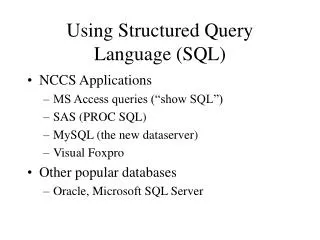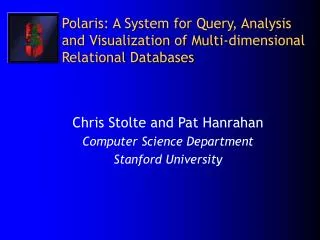
Query, Analysis, and Visualization of Hierarchically Structured Data using Polaris
350 likes | 573 Vues
Query, Analysis, and Visualization of Hierarchically Structured Data using Polaris. Chris Stolte, Diane Tang, Pat Hanrahan July 2002. Motivation. Large databases have become very common Corporate data warehouses Amazon, Walmart,… Scientific projects: Human Genome Project

Query, Analysis, and Visualization of Hierarchically Structured Data using Polaris
E N D
Presentation Transcript
Query, Analysis, and Visualization of Hierarchically Structured Data using Polaris Chris Stolte, Diane Tang, Pat Hanrahan July 2002
Motivation • Large databases have become very common • Corporate data warehouses • Amazon, Walmart,… • Scientific projects: • Human Genome Project • Sloan Digital Sky Survey • Need tools to extract meaning from these databases • Programmatic data mining/statistical analysis • Visual exploration and analysis
Hierarchical Structure • Challenge: these databases are very large • Queries can not visit every record • Visualizations can not display every record • Analysts have augmented databases with hierarchical structure • Provide meaningful levels of abstraction • Leveraged by both computer and analyst • Derived from semantics or programmatic analysis • Tools need to take advantage of these hierarchies
Contributions • Interactive tool for analysis of data warehouses with hierarchical structure • Based on Polaris* • Rapid construction of table-based visualizations • Algebraic formalism • Analysis of flat relational databases • To support hierarchies, we need to extend: • User interface • Algebraic formalism • Generation of data queries * C. Stolte, D. Tang, and P. Hanrahan. Polaris: A System for Query, Analysis, and Visualization of Multi-dimensional Relational Databases. In IEEE Transactions on Visualization and Computer Graphics, January 2002.
Outline • Review of Polaris • Demo • Formalism • Hierarchies and Data Cubes • Extensions to Polaris • Demo • Formalism • Discussion
Schema: Denormalized Relation Market State Year Quarter Month Product Type Product Profit Sales Payroll Marketing Inventory Margin COGS ... Hypothetical nation-widecoffee chain data(courtesy Visual Insights) Ordinal fields (categorical) Quantitative fields (metrics)
Polaris Review • Provide an interface for rapidly and incrementally generating table-based graphical displays • Users construct visualizations via a drag-and-drop interface • Queries are automatically generated • Interface is simple and expressive because built upon a formalism
Polaris Formalism • UI interpreted as visual specification that defines: • table configuration • type of graphic in each pane • encoding of data as visual properties of marks • data transformations • Specification automatically compiled into necessary queries & drawing commands
Polaris Formalism • UI interpreted as visual specification that defines: • table configuration • type of graphic in each pane • encoding of data as visual properties of marks • data transformations • Specification automatically compiled into necessary queries & drawing commands
Specifying Table Configurations • Interface: define table configuration by dropping fields on shelves • Formalism: shelf content interpreted as expressions in table algebra
Table Algebra • Operands are the database fields • each operand interpreted as a set {…} • quantitative and ordinal fields interpreted differently • Three operators: • concatenation (+), cross (X), nest (/)
Table Algebra: Operands • Ordinal fields: interpret domain as a set that partitions table into rows and columns: Quarter = {(Qtr1),(Qtr2),(Qtr3),(Qtr4)} • Quantitative fields: treat domain as single element set and encode spatially as axes: Profit = {(Profit[-410,650])}
Quarter + ProductType = {(Qtr1),(Qtr2),(Qtr3),(Qtr4)} + {(Coffee), (Espresso)} = {(Qtr1),(Qtr2),(Qtr3),(Qtr4),(Coffee),(Espresso)} Concatenation (+) operator • Ordered union of set interpretations: Profit + Sales = {(Profit[-310,620]),(Sales[0,1000])}
Cross (x) operator • Cross-product of set interpretations: Quarter x ProductType = {(Qtr1,Coffee), (Qtr1, Tea), (Qtr2, Coffee), (Qtr2, Tea), (Qtr3, Coffee), (Qtr3, Tea), (Qtr4, Coffee), (Qtr4,Tea)} ProductType x Profit =
Nest (/) operator • Quarter x Month • would create entry twelve entries for each quarter. i.e., (Qtr1, December) • Quarter / Month • would only create three entries per quarter • based on tuples in database not semantics • can be expensive to compute
Outline • Review of Polaris • Demo • Formalism • Hierarchies and Data Cubes • Extensions to Polaris • Demo • Formalism • Discussion
Each cell summarizes all measures for those dimension values Each cube dimension corresponds to a dimension in the relation Data Cubes • Structure relation as n-dimensional cube
Hierarchies and Data Cubes • Each dimension in the cube is structured as a tree • Each level in tree corresponds to level of detail • Nodes correspond to domain values
Hierarchies and Data Cubes • Some hierarchies known apriori • Provide semantic meaning • Time (day, month, year)Location (city, state, country) • Can be automatically generated • Classification algorithms • Clustering • Enable analyst to reason at high level of abstraction then drill down • Interface must expose underlying hierarchical structure
Hierarchy Model • Our model assumes that hierarchies: • Can be modeled using star or snowflake schema • Have uniform depth • Have homogenous node types • Other models relax these constraints • Chose to focus on model commonly found in commercial data warehouse and data cube products
Outline • Review of Polaris • Demo • Formalism • Hierarchies and Data Cubes • Extensions to Polaris • Demo • Formalism • Discussion
Schema: Star Schema Dimension Table Fact table Time Year Quarter Month Location Market State State Month Product Profit Sales Payroll Marketing Inventory Margin COGS ... Products Product Type Product Name Measures
Extending the Formalism • Redefine operands as dimension levels and measures not simply database fields • Need to define set interpretation of a dimension level • Domain is not a single ordered list • Composed of node values at particular level in hierarchy • Node values are uniquely defined by the path from root node • Possible definitions?
Set Interpretation: Option 1 • Define set interpretation by listing each node value with unique path to root: {1998.Qtr1.Jan, …., 1998.Qtr4.Dec} (+) Provides unique set interpretation (-) Limits expressiveness • Any table including “Months” must include “Year” • Not possible to summarize across years (e.g., Total Sales in January for all Years) • Not a standard projection of data cube but very useful
Set Interpretation: Option 2 • Define set interpretation by listing each node value without path to root: {Jan, Feb, …., Dec} • Order by depth first traversal • Consolidate non-unique values This works—but how do we leverage known relationship between dimension levels?
Dot (.) Operator • Nest isn’t aware of defined hierarchical relationships: • Year / Months might work—if all data present • Inefficient • New operator: Dot (.) • Nest computed using the dimension table rather then the fact table • Sufficient to provide support for aggregation, drill down, and roll up in algebra.
Generating Queries • Queries generated from specification. • Panes correspond to either a slice of a projection or an aggregation of a projection. • Multiple queries required if level-of-detail varies. • Algebraic manipulation can be used to determine minimal set of queries. • Interpreter generates SQL, MDX, or Rivet queries.
Related Visualization Projects • Formalisms for Graphics • Wilkinson’s Grammar of Graphics • Bertin’s Semiology of Graphics • Mackinlay’s APT • Visual Exploration of Databases • VQE, DeVise, Visage, DataSplash/Tioga-2,… • Visualization and Data Mining • MineSet, …
Data Mining and Visualization • Polaris not solely for visual analysis • Precursor to algorithmic analysis to identify areas of interest • Validate results and establish trust and understanding • Incorporate decision trees and classification algorithms into data warehouses as hierarchies
Summary • Extended Polaris to fully support and expose hierarchical structure of data cubes • Extended not only interface but underlying algebraic formalism
Future Work • Use underlying formalism as basis for other visualization tools • Interactive pan-and-zoom systems
Future Work • Visual presentation of metadata • Hierarchies are one example of rich, domain specific metadata • As important to analysis as data itself • How to visualize this metadata?
Future Work • Interactive visualization • Prefetching and Caching