Download
1 / 31
310 likes | 422 Vues
The 2011 BSRN report presented during the GRP Meeting in Tokyo provides a comprehensive overview of the Baseline Surface Radiation Network's contributions and recent activities. It highlights the importance of high-quality in situ surface irradiance observations established since 1992, with 53 sites active globally, including significant contributions from Japan. Key topics include measurement uncertainty, data processing improvements, and collaborations with international networks. The report emphasizes the need for continued advancements in technology and methodology to enhance our understanding of surface radiation dynamics and climate interactions.

E N D
Baseline Surface Radiation Network (BSRN) Report to GRP, 2011 Ellsworth Dutton BSRN International Project Manager NOAA/GMD, Boulder, Colorado E.G. Dutton GRP Mtg., 2011 Tokyo, Japan
OUTLINE • Overview • Background and status • BSRN news • Highlights of Japanese contributions • In situ irrad. measurement uncertainty for the RFA • theoretical vs. practical • redundant instrument pairs • monthly averaging with missing data Misc. topics • Recent changes in background stratospheric aerosol • Update on in situ solar & IR irradiance “trends” • Deriving cloud information from in situ irradiance obs. E.G. Dutton GRP Mtg., 2011 Tokyo, Japan
BSRN Background and Status • Implemented in 1992 by GRP predecessor to address lacking quantity and quality of globally remote, spatially representative, in situ, surface irradiance obs • Intended primarily for GEWEX product validation but caught the interest of a broader community for multiple applications • Has remained truly international • BSRN BAMS article (1998) ~ 200 citations E.G. Dutton GRP Mtg., 2011 Tokyo, Japan
BSRN Status/News • AWI Archive and field site status • 53 sites have contributed solar and IR data • >6080 station-months data since 1992 • 16 sites with 2011 data! • 4 of the 53 are dormant or gone, 7 are delinquent • ~6 pending new candidate sites • Several “offered” sites have been rejected • Invited by NDACC (Network for the Detection of Atmospheric Composition Change) as a coop network, follows similar invitations from GAW and GCOS • Spectral AOD – uniform processing and distribution – problematic • RFA activities • Likely Canadian shutdowns • Next BSRN meeting being planned around IRS in Germany, early Aug 2012 • Any suggestions for a change in BSRN management are welcome E.G. Dutton GRP Mtg., 2011 Tokyo, Japan
Example Japanese Contributions to BSRN • Original participant providing two sites • Regular participation in all BSRN biennial meetings, GCOS liason • First to share data processing software • Valuable contributions to BSRN measurement improvement • Currently operating six sites, including two remote islands, second most of any country Sapporo Tateno Fukuoka Ishigakijima Minamitorishima Syowa E.G. Dutton GRP Mtg., 2011 Tokyo, Japan
Japanese BSRN stations • Japan Meteorological Agency (JMA) has been operating 6 BSRN stations (5 in Japan and 1 in Antarctica) to make contribution to the GEWEX and GCOS activities. Ishigakijima Minamitorishima 1km 15km (c)Google – image (c)2010 DigitalGlobe, GeoEye E.G. Dutton GRP Mtg., 2011 Tokyo, Japan (c)2010 Google – image (c)2010 TerraMetrics
Measurement Uncertainty in situ surface irradiance • A primary BSRN contribution to the RFA, in addition to validation data • Traditional theoretical error analysis vs. the practical reality of continuous, long-term, remote field measurements • Two approaches to addressing uncertainty reality: • Redundant measurement comparisons • Impacts of missing data on monthly averages • A. Roesch et al paper – effects of different averaging methods • Replicate missing data and re-average E.G. Dutton GRP Mtg., 2011 Tokyo, Japan
Probable in situ Irradiance Errors Determined from Redundant Instrument Pairs Direct Solar Diffuse Solar Thermal Infrared Similar result from C. Long, ARM triads ,±95% Effects of Time Averaging 95% limits , W m-2 E.G. Dutton GRP Mtg., 2011 Tokyo, Japan Total Solar
Comparison of monthly averages of 307 complete months to average of the same months but with data removed according to actual missing data from the month in a different year. Upper left are the differences if the missing data are not filled, bottom two are filled using two different methods similar to that used to generate the BSRN RFA data sets . E.G. Dutton GRP Mtg., 2011 Tokyo, Japan
Same as previous slide except for LWD (IR). 3rd fill method (upper right) is a variation on method 2. E.G. Dutton GRP Mtg., 2011 Tokyo, Japan
Some thoughts on in situ surface irradiance observations after the RFA experience • Central QC needs to be applied at the archive level • The largest source of unknown uncertainty in the measurements will be optical surface cleanliness. • A new generation of sensors is becoming available and field sites should be upgraded. • Multiple redundant systems should be deployed for routine field observations, unless the measurement system of choice has a total uncertainty about ≥10 times better than the final desired accuracy, e.g., US CRN. • Continued sustained surface-based obs are not assured, subject to usual budget cycles and constraints • International calibration reference standards need to be institutionally strengthened to endure for the long term E.G. Dutton GRP Mtg., 2011 Tokyo, Japan
END (tentative) E.G. Dutton GRP Mtg., 2011 Tokyo, Japan
E.G. Dutton, GMAC 2011 May 17 Boulder, CO
Summary/Conclusions • “The Persistently Variable “Background” Stratospheric Aerosol Layer and Global Climate Change” Solomon, S., J. S. Daniel, R. R. Neely III, J. P. Vernier, E. G. Dutton, and L. W. Thomason, 2011 Science, Published online 21 July, Science Express, 2011,DOI:10.1126/science.1206027] • Widely observed baseline AOD has increase from ~2000 to ~2010, not necessarily monotonically • The increase was observerd by sunphotometer, ground and satellite lidars and is mostly in the stratosphere • Observed aerosol change (ΔAOD ≈0.004), if global, appears sufficient to potentially negate about 1/4 of the expected CO2 warming over the same time period (which may have happened.) • To refine, better information is needed on the spatial/temporal distribution of the aerosol optical properties, specifically τ, g, and ωo in that order E.G. Dutton, GMAC 2011 May 17 Boulder, CO
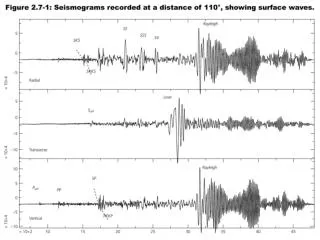
Atmos. solar transmission from direct irradiance obs
Figure 5.2.1: Comparison matrices showing the mean differences of monthly surface irradiance averages computed by 7 different averaging methods M1-M7 described in Roesch. Quantities clockwise from the upper right panel are Global SW, Direct SW, Diffuse SW, and Downwelling IR. Approximately 5200 station-months of BSRN data were used to compile each of the above charts. Blanks in the SWDIR are because those comparisons were not possible with the data provided. (figure from Roesch et al., 2011)
Hofmann et al., GRL 2009 R. Neely updates E.G. Dutton, GMAC 2011 May 17 Boulder, CO
CALIPSO Satellite Lidar Backscatter (NASA) Vernier et al., JGR 2009 E.G. Dutton, GMAC 2011 May 17 Boulder, CO
U.S. SURFRAD Network Monthly Minimum 500 nm AOD J. Augustine et al., 2008 E.G. Dutton, GMAC 2011 May 17 Boulder, CO
What is the global direct radiative forcing for a change in stratospheric aerosol? An example estimate for the 2000s Solar forcing • RF ≈ -So•(1-α) • (1- exp(-Δτ)) •(1- g)•(ωo) where: RF- direct aerosol radiative forcing So - avg. incident solar irradiance at TOA (340 Wm-2) α - underlying albedo, mean planetary (0.30) Δτ - change in aerosol optical depth (+0.003 to +0.005 at 500nm) g - aerosol asymmetry factor (0.7 to 0.85) ωo - single scat. albedo (1- absorption) >~ 0.97 (strat. warm) • RF = -0.10 to -0.34 Wm-2 (at the end of the decade) • RFefficiency (RFE) = RF / Δτ = -34 to -69 Wm-2/unit τ Infrared forcing? E.G. Dutton, GMAC 2011 May 17 Boulder, CO
Compared to CO2 radiative forcing over same time period (2000-2009) • RF2xCO2 = 3.7 W m-2, 270 to 540 ppm (IPCC) • RFECO2 = 3.7/ln(2) = 5.34 W m-2 per ln(ppm2/ppm1) • Delta CO2 , 369 to 390 ppm (2000 to 2010 MLO) • RFΔCO2 = 5.34 ∙ln(390/369) = +0.29 Wm-2 • netRFaerosol = -0.08 to -0.16 Wm-2 • Potential global surface air temperature impact • Volcanic Aerosol Efficacy = ~0.91 (Hansen 2005) • RF’aero = 0.91 • (-0.08 to -0.16 )Wm-2 dec-1 2000s “observed BG” direct aerosol global temperature forcing could be equal, but opposite in sign, to 1/4 to 1/2 that of CO2 for the same time period. E.G. Dutton, GMAC 2011 May 17 Boulder, CO
2000s Aerosol Radiative Forcing Example Calcs. (Con’t) Infrared RF contribution • Very few observations of optical properties • Several published modeled values for volcanic: -⅓ to -¼ of solar RF Net Direct Aerosol Forcing Efficiency (Solar + IR Forcing) • From example: -34 ∙ 0.66 to -69 ∙ 0.75 (-23 to -52) W m-2/unit τ • From detailed Pinatubo calcs. – 25 (J. Hansen, 2005), 30 (A. Lacis, 2000), 31 (E.G. Dutton, 1995) W m-2/unit τ • NetRF estimate for 2000 to 2010 • Use detailed calcs for netRFE = -25 to -31 W m-2/unit τ • RFnet = Δτ∙ netRFE = (0.003 to 0.005) ∙ (-25 to -31) • RFnet range = -0.08 to -0.16 W/m-2 • How does this compare to CO2 forcing over same time period ? E.G. Dutton, GMAC 2011 May 17 Boulder, CO
E.G. Dutton, GMAC 2011 May 17 Boulder, CO
International GAW AOD network - 500nm AOD Monthly Minimums (PFR Sun Photometer) C. Wehrli GAW/PFR Archive E.G. Dutton, GMAC 2011 May 17 Boulder, CO