Download
1 / 37
370 likes | 451 Vues
Explore how U.S. recessions and federal cutbacks are affecting Virginia's economy, job market, and state budget, leading to the need for significant cuts and strategic planning for local governments. Learn about the challenges and potential solutions faced by Virginia amid changing economic dynamics.

E N D
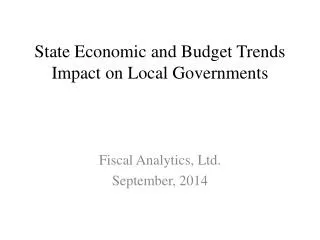
State Economic and Budget Trends Impact on Local Governments Fiscal Analytics, Ltd. September, 2014
2014-16 Budget Now Requires an Additional $882 Million in Cuts • In FY 14, VA GF revenue declined for the first time without a U.S. recession (-1.6 percent, or $439 mil. below official forecast). - Non-withholding income tax payments were the primary reason for the missed forecast. Final payments were $342 million below previous tax year. Withholding grew 2.3%. - Sales and corporate income taxes fell 4.8% and 4.9%. - Lower FY 14 GF revenue base carries over into 2014-16. • Additional GF reduction of $882 million forecast ($346 m in FY 15 and $536 m in FY 16) beyond the $1.55 billion shortfall anticipated in the June 23 adopted 2014-16 budget. Total GF growth lowered to 2.7%/yr. - Re-forecast of GF revenues further reduces payroll withholding growth expectations from 4.5 percent to 2.7 percent in FY 15. - Non-withholding forecast capped at 15 percent of total GF revenue collections.
Despite 5 Years of U.S. Economic Recovery, • Federal Cutbacks Are Hurting Virginia’s Economic Recovery • In 2010, federal spending ($137 B total; $58B DoD) contributed approximately one-third of Virginia’s gross state product ($424 B). - VA ranked #2 in total per capita federal spending and#1 in per capita DoD spending in 2010. • From CY 2000-10 federal spending in VA grew 107% versus 60% in total Virginia’s gross state product. • In federal fiscal year 2013, federal spending* grew only 0.7 percent, with military spending declining7.2 percent. Thru July FFY 2014, total spending* increased 0.4% with defense spending declining 5.8 percent. • Chmura Economics recently reported the DoD spent a total of $41.4 billion on direct operations and contracts in Virginia in 2013, down from $54.8 billion in 2012. * Not including interest on debt and GSE payments. 4 4 4 4
Virginia Payroll Employment Growth Source: Bureau of Labor Statistics/Haver Analytics 5
Virginia Has a Much Higher Percentage of Professional and Business Service Jobs Than the Nation Source: Bureau of Labor Statistics/Haver Analytics 6 6
Federal Cutbacks Have Resulted • in Low Job Growth in High-Paying Jobs Percent Change in Employment from a Year Ago, NSA Source: Bureau of Labor Statistics/Haver Analytics
Virginia’s Replacement of High Paying With Low Paying Jobs • Helps Explain Slow Growth in Wages and Tax Revenues Health, Leisure, and Hospitality Professional and Business Services
High Paying Business and Professional Jobs Generate Significant Tax Revenue 9 9
Virginia Wages and Salary Growth Significantly Below U.S. Source: Bureau of Economic Analysis/HaverAnalytics
13 13 13
Includes GF, lottery profits, miscellaneous NGF, and state appropriated federal stimulus funds adjusted by the CPI 15
Relative State Aid to Localities Still Declining in Adopted Budget 16 16
Long-Term Headwinds for IncreasingState Support for Local-Administered Programs • How will the Virginia economy replace the loss of high paying business and professional jobs? Will highly paid professionals transition to new industries? • Medicaid program continuing to grow faster than GF revenues. • Will VRS rates for teachers and state-supported employees continue to rise? Will recent good VRS investment returns help rate outlook? 2014-16 VRS teacher rates rose 24 percent from 11.66% to 14.5%. • State continues to incur more GF debt service due to lack of a pay-as-you-go capital program. Lower revenues will impact new debt capacity. • More general funds for transportation scheduled.
18 18
Without Tax Increases Local Revenues Will Not Offset State Funding Losses Real Property Total Local Revenues 19
Tough Choices Continued • for Local Budgets in FY 2014 * 11 of 44 localities increased RE tax rates - 8 at rate greater than equalization 20 20 20 20 Source: Results from VML/VACO 2013 fiscal survey
Does Fall 2008 Budget Balancing Actions Provide Clues for Fall 2014?
Non-Recurring Budget Balancing Actions Enacted During the Great Recession • $50 million per year “clawback” in aid-to-localities for the 2008-10 biennium and $60 million per year in the 2010-12 biennium. • Replace cash for capital projects to debt - $350 mil. • Accelerated Sales Tax Collections from July to June – $241.8 mil. • Tax Amnesty Program - $102.1 mil. • Transfer non-general fund balances to general fund - $83.3 mil. • Temporarily adjust FY 10 Land Preservation Tax Credit - $50 mil. • University of Virginia/Radford balances for debt - $48.9 mil. • Revert capital/maintenance reserve balances - $41.1 mil. • Replace Fire Programs Fund balance with credit line - $26.0 mil. • Enhanced Tax Compliance $22.9 mil. • Divert interest on non-general fund accounts - $17.7 mil. • Sale of surplus property and helicopter - $6.6 mil. • Eliminate sales tax dealer discount for electronic filers - $98.2 mil.
Retirement/Benefit Savings Actions Enacted During the Great Recession • $87 mil. in FY 2010 by suspending employer retirement contributions for teachers and state employees in 4th Q. • $325 mil. in FY 2011 and $296 million in FY 2012 by using a lower than actuarial certified VRS rate for state employee and teacher retirement. • $13 mil. in 4th Q FY 2010 by suspending employer contributions for Group Life/Disability Insurance, and the Retiree Health Care Credit. • $94.5 mil. from Group Life/Disability Insurance premium holiday in 2010-12 biennium. • $20 mil. by recording employee retirement contributions in July instead of June 2010. • $9.8 mil. from one day furlough of state employees in FY 2010. • $70 mil. by reverting retiree health care credit balances.
Transportation Will Still Be a Challenge • In February, VDOT reported that the state revenue forecast for FY 2014 – 19 would be reduced by $796.0 million, mainly due to lower motor fuel prices than originally expected in HB 2313. • For the same period, VDOT forecasted a reduction of $123.0 million in federal and other sources. • For the FY 2015 – 20 improvement program, VDOT forecasted $491.0 million less than the previous six-year improvement program. • $55.0 million less in state and federal revenues • $436.0 million less in anticipated bond sales • The projections for the new six-year improvement program mean fewer construction dollars. • Elimination of funds for urban and secondary roads through the construction formula. • Transfers from the construction budget to maintenance is projected at $724.4 million for fiscal years 2015 – 2020.
Public Transit Challenges • If Congress fails to pass the Marketplace Fairness Act (MFA) by January 1, 2015, then the motor fueltax at the “rack” increases by 1.6% to make up the revenue loss. • However, the new increment would be used exclusively for road maintenance. Transit would have received a share of MFA revenue. Without MFA, DRPT expects $20.0 million less revenue for transit projects. • After the state bonds for transit are exhausted in FY 19, even with the HB 2313 revenues the state match for transit capital projects will drop to about 10.0 percent by FY 20. Dropping from $160.0 million in FY15 to less than $120.0 million in FY 2020 and to just over $60.0 million by FY 2023. 27
Local Funding Will Continue to be Needed for Transportation System • Local urban street maintenance expenditures exceeded state payments by 32% in FY 2012.* • - Recent VDOT pavement condition survey found urban locality pavements in worse condition, despite spending a higher percent of funds on paving, than VDOT maintained roads. • Including capital outlay expenditures, local unreimbursed expenditures for highways exceeded$366 million in FY 2012, not including toll revenue, and debt service for transportation bonds.* • State revenue sharing increasing. $181 mil. for 212 projects allocated to 79 localities in FY 15. • Local general funds subsidizing public transit include $265 million for operating assistance and $58 million for capital in FY 2013.** • More special tax districts, such as commercial and industrial property in NVTD (up to 0.125 per $100) for transportation. * FY 2012 Weldon Cooper Road, Street, and Highway Finance Survey ** Dept. of Rail and Public Transportation SYIP 28 28 28 28 28 28
Virginia Housing Starts Stuck in Low Gear Source: Bank of Tokyo-Mitsubishi UFJ/HaverAnalytics 31
…And VA Prices Growing Slower Than U.S. Avg. • House Price Index—FHFA Source: Federal Housing Finance Agency/Haver Analytics
33 33 33
Rainy Day Fund Withdrawals: Half of Budget Shortfall or Max. Half of RDF Balance * Includes mandatory FY 15 deposit of $243.2 million from FY 13 revenues. RDF withdrawals in FY 15 and 16 of $470m and $235m expected.
Virginia Is a Wealthy, Relatively Low Tax State, With Higher Reliance on Locality Taxes Source: Virginia Compared to Other States, JLARC, 2013 Edition 35
Virginia Spending Rankings • Reflect Tax Policies 36
Virginia Board of Education Recommended, But Unfunded, Changes to the SOQ 37 37