Download
1 / 21
210 likes | 291 Vues
where can retail investors take refuge in 2008?. ANIL THAKERSEE MD, Old Mutual Unit Trusts. Consumers under pressure… Food and petrol prices high, but CPIX forecast improving. 20. 20. CPIX food + petrol. CPIX. 15. CPIX excl food. 15. & petrol. 10. 10. 5. 5. 0. 0. 00. 02. 04.

E N D
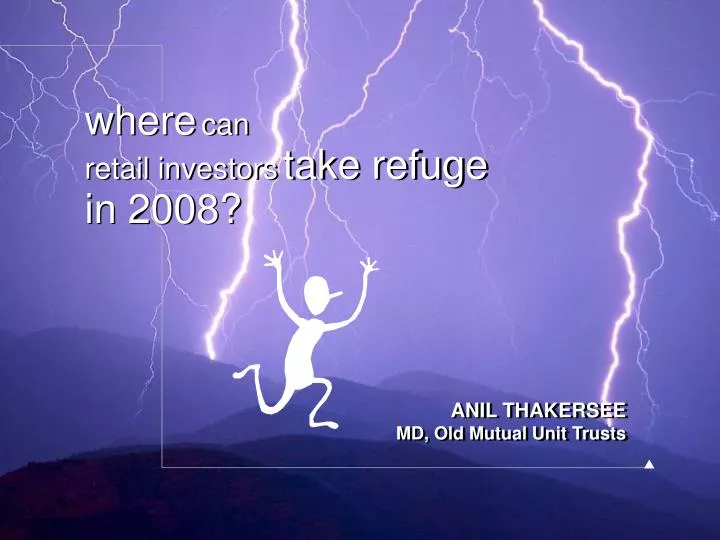
wherecan retail investorstake refugein 2008? ANIL THAKERSEEMD, Old Mutual Unit Trusts
Consumers under pressure…Food and petrol prices high, but CPIX forecast improving 20 20 CPIX food + petrol CPIX 15 CPIX excl food 15 & petrol 10 10 5 5 0 0 00 02 04 06 08 UT\PressConf_0108_RS Anil2
Consumers under pressure… 40% rise in interest rates since June 2006 Prime rate + current forecast 30 30 25 25 20 20 15 15 10 10 5 5 86 88 90 92 94 96 98 00 02 04 06 08 UT\PressConf_0108_RS Anil2
Consumers under pressure... Spending growth to continue to slow % 10.0 20 Disposable income growth Real HCE growth 7.5 15 5.0 2.5 10 0.0 5 CPIX -2.5 Real PDI growth -5.0 0 92 94 96 98 00 02 04 06 08 92 94 96 98 00 02 04 06 08 UT\PressConf_0108_RS Anil2
17.5 15.0 12.5 10.0 7.5 5.0 2.5 70 75 80 85 90 95 00 05 Consumers under pressureDebt levels high… Household debt as %of disposable income Household debtservicing burden 80 70 60 50 40 30 70 75 80 85 90 95 00 05 UT\PressConf_0108_RS Anil2
Consumers under pressure…but not yet pushed to the limit Debt summonses(individuals) Insolvencies(individuals & partnerships) 160 800 140 600 120 400 100 200 80 0 60 85 90 95 00 05 85 90 95 00 05 UT\PressConf_0108_RS Anil2
3 burning questions facing investors in 2008 • Is the “free lunch” in the market over? • Am I invested the right fund? • Do I stop saving and reduce debt? UT\PressConf_0108_RS Anil2
30000 35 SAVI (LHS) FTSE / JSE TOP40 index (RHS) 28000 30 26000 25 Volatility (%) Index level 24000 20 22000 15 Jul-07 Oct-07 Apr-07 Jun-07 Feb-07 Mar-07 Aug-07 Sep-07 Nov-07 Dec-07 May-07 Equity market volatility has risen markedly SA Volatility Index (SAVI) compared to TOP40 Index Source: OMIGSA UT\PressConf_0108_RS Anil2
Market reverting to the mean? 3 year rolling REAL returns (JSE AlSI 1960 to date) 60% 50% 40% 30% 20% 10% 0% -10% -20% -30% 63 68 73 78 83 88 93 98 03 JSE All Share Index Average High Above 30% 3 Years Later UT\PressConf_0108_RS Anil2
Conservative unit trust returns deteriorate in 2007 UT Sector Average Three-Year Returns 40% CPIX 35% 30% 25% 20% 15% 10% 5% 0% Feb-06 Dec-07 Feb-06 Dec-07 Feb-06 Dec-07 Feb-06 Dec-07 Prudential Low Prudential Medium FI Varied Specialist Absolute Targeted Return UT\PressConf_0108_RS Anil2
Overcoming Turbulence:Solutions for different investor risk profiles • For retirees, higher interest rates is not all bad news. • If you are a few years from retirement, capital preservation (in real terms) is important. • For the rest…tough-it-out during the short-term turbulence. In the long term this is all noise. UT\PressConf_0108_RS Anil2
Money Market returns rising UT\PressConf_0108_RS Anil2
Asset allocation funds – already popular Assets CAGR 458.3 496.4 596.1 R’bn 415.1 546.7 646.0 390.9 455.3 621.1 28.6% Equity (incl Real Estate) 25.7% 18.4% Money Market Asset Allocation 55.7% 21.5% Fixed Interest Foreign & Worldwide 37.4% Net Flows R’billion Money Market Asset Allocation Fixed Interest Foreign & Worldwide Equity (incl Real Estate) UT\PressConf_0108_RS Anil2
65+ 55 45 30 Asset allocation funds : Inflation-beating returns at less riskLife Stages - Income vs Time Line Conservative Balanced Flexible 2 3 4 Real Income(6.5% yield) Stable Growth(5.5% yield)* Income % Balanced (4.5% yield) Flexible (4.0% yield) Wealth preservation LIFE STAGES Wealth creation Need Income now 5+ Yrs Short Long Term to Consumption * Note: These represent the estimated 3-year forward yields on investments made now. Income from international assets have been ignored. In the short term, yields for the Balanced and Flexible Funds are likely to be lower. UT\PressConf_0108_RS Anil2
Absolute Return fundsBeware big strategy differences 20% Maximum Exposure : 97.6% Minimum Exposure : 0.0% 18% Median Exposure : 51.7% 16% OMRealIncome OMDynamicFloor 14% 12% 10% % of Total Funds 8% 6% 4% 2% 0% 0-10 10-20 20-30 30-40 40-50 50-60 60-70 70-80 80-90 90-100 Equity Exposure (%) Funds with assets >R50m (39 funds) Source: ACI Industry Statistics - September ‘07 UT\PressConf_0108_RS Anil2
Absolute Return sector homogeneityrange between min and max within sectors – 3 years Low Homogeneity DEQ Res & Bas Indust (30;12) High Homogeneity Source: ACI Statistics, S&P MorningStar and OMIGSA UT\PressConf_0108_RS Anil2
Do I stop saving and reduce debt? • Only if you are highly indebted, pay off expensive debt like credit cards • This “bad” debt takes priority over “good” debt like home mortgages • Consider consolidating your debts to more easily manage them • Otherwise, stick to your long-term retirement goals and remember that we are in a short-term interest rate up-cycle UT\PressConf_0108_RS Anil2
For the rest…tough-it-outFTSE/JSE All Share Index (capital returns) 1960 - 2007 35 000 7,500 7 000 30 000 6,500 25 000 6 000 All Share Index price 5,500 -39% 20 000 5 000 15 000 4,500 10 000 Sep ‘97 Sep ‘98 5 000 1960 1970 1980 1990 2000 2007 UT\PressConf_0108_RS Anil2
What are investors to do? • Stick to the long term plan – trim luxuries • Manage debt • Opt for inflation-beating investment strategies • Strategy depends on individual circumstances: • Retirees have opportunity to lock in higher rates • Those near retirement consider absolute return funds • Those with longer investment term can still opt for equities despite short-term market volatility • Consider offshore investment if rand weakness a concern UT\PressConf_0108_RS Anil2
OMIGSA economic forecasts: 2008 • GDP growth to slow to 4.5% y/y from 5.0% in 2007 • CPIX inflation to fall to an average of 6.3% from 6.5% in 2007. CPIX should end 2008 at 5.0%. • Interest rates will remain high. We don’t expect the SARB to hike next week, but we are forecasting no rate cuts in 2008. • The current account deficit to remain stable in absolute terms at approximately R140bn, but should improve to 6.5% of GDP in 2008 from 7.0% of GDP in 2007. • The rand will be at its most vulnerable in years against the dollar due to pressures from the large current account deficit, fragile offshore sentiment (flight to safehavens may continue on USD weakness and wariness around the liquidity crisis) and possibly softer commodity price cycle. We expect the rand to weaken slightly against a relatively weak US dollar, and even more against the euro. As of end-2008: R/USD at 7.15, R/Euro at 10.58 and R/Stlg at 13.66. UT\PressConf_0108_RS Anil2
Regulatory Information Old Mutual Investment Group (South Africa) (Pty) Limited Physical Address: Mutualpark, Jan Smuts Drive, Pinelands, 7405 Telephone number: +27 21 509 5022 Old Mutual Investment Group (South Africa) (Pty) Limited is a licensed financial services provider, FSP 604, approved by the Registrar of Financial Services Providers (www.fsb.co.za) to provide intermediary services and advice in terms of the Financial Advisory and Intermediary Services Act 37 of 2002. Old Mutual Investment Group is a wholly owned subsidiary of Old Mutual (South Africa) Limited. Reg No 1993/003023/07. The investment portfolios may be market-linked or policy based. Investors’ rights and obligations are set out in the relevant contracts. Market fluctuations and changes in rates of exchange or taxation may have an effect on the value, price or income of investments. Since the performance of financial markets fluctuates, an investor may not get back the full amount invested. Past performance is not necessarily a guide to future investment performance. Personal trading by staff is restricted to ensure that there is no conflict of interest. All directors and those staff who are likely to have access to price sensitive and unpublished information in relation to the Old Mutual Group are further restricted in their dealings in Old Mutual shares. All employees of Old Mutual Investment Group are remunerated with salaries and standard short-term and long-term incentives. No commission or incentives are paid by Old Mutual Investment Group to any persons. All inter-group transactions are done on an arms lengths basis. In respect of pooled, life wrapped products, the underlying assets are owned by Old Mutual Life Assurance Company (South Africa) Limited who may elect to exercise any votes on these underlying assets independently of Old Mutual Investment Group. In respect of these products, no fees or charges will be deducted if the policy is terminated within the first 30 days. Returns on these products depend on the performance of the underlying assets. Old Mutual Investment Group has comprehensive crime and professional indemnity insurance. For more detail, as well as for information on how to contact us and on how to access information please visit www.omigsa.com. UT\PressConf_0108_RS Anil2