Database Design: Logical Models: Normalization and The Relational Model
790 likes | 960 Vues
Learn about database design process including normalization, logical and relational models. Understand application of conceptual requirements in designing databases. From data collection to physical design, grasp key steps in creating efficient database systems.

Database Design: Logical Models: Normalization and The Relational Model
E N D
Presentation Transcript
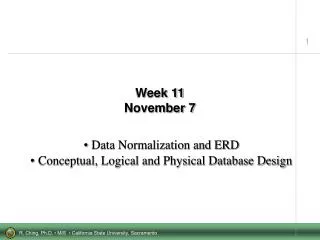
Database Design: Logical Models: Normalization and The Relational Model
Database Design Process Application 1 Application 2 Application 3 Application 4 External Model External Model External Model External Model Application 1 Conceptual requirements Application 2 Conceptual requirements Conceptual Model Logical Model Internal Model Application 3 Conceptual requirements Application 4 Conceptual requirements
Draw ER Diagram • A Bus Company owns a number of busses. Each bus is allocated to a particular route, although some routes may have several busses. Each route passes through a number of towns. One or more drivers are allocated to each stage of a route, which corresponds to a journey through some or all of the towns on a route. Some of the towns have a garage where busses are kept and each of the busses are identified by the registration number and can carry different numbers of passengers, since the vehicles vary in size and can be single or double-decked. Each route is identified by a route number and information is available on the average number of passengers carried per day for each route. Drivers have an employee number, name, address, and sometimes a telephone number.
Draw ER Diagram • A lecturer, identified by his or her number, name and room number, is responsible for organizing a number of course modules. Each module has a unique code and also a name and each module can involve a number of lecturers who deliver part of it. A module is composed of a series of lectures and because of economic constraints and common sense, sometimes lectures on a given topic can be part of • more than one module. A lecture has a time, room and date and is delivered by a lecturer and a lecturer may deliver more than one lecture. Students, identified by number and name, can attend lectures and a student must be registered for a number of modules. We also store the date on which the student first registered for that module. Finally, a lecturer acts as a tutor for a number of students and each student has only one tutor.
Proj.Scope Database Design Steps Requirements Collection and Analysis Internal Schema DB Requirements Physical Design Conceptual Design Conceptual Schema (in high-level data model E.g. ER model) Conceptual Schema (in DBMS specific data model e.g. relational model) Logical Design DBMS-independent DBMS specific
I. Requirements Analysis • Purpose: identify/describe data required by users • Input: Functional and Data requirements • Output: User specifications II. Conceptual Design • Purpose: synthesize diff. users' views to global database design • Input: User requirements from (I) & functional requirements • Output: high-level data model
III. Logical Design (implementation design) Purpose: to map conceptual design into specific DBMS IV. Physical Design Purpose: Concerned with factors relating to performance
Project Identification and Selection Project Initiation and Planning Analysis Logical Design Physical Design Implementation Maintenance The Physical Design Stage of SDLC (Figures 2-4, 2-5 revisited) Purpose – information requirements structure Deliverable – detailed design specifications Logical Design Database activity – logical database design Maintenance
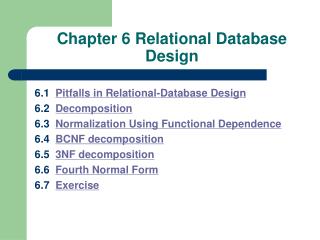
Relation • Definition: A relation is a named, two-dimensional table of data • Table consists of rows (records), and columns (attribute or field) • Requirements for a table to qualify as a relation: • It must have a unique name. • Every attribute value must be atomic (not multivalued, not composite) • Every row must be unique (can’t have two rows with exactly the same values for all their fields) • Attributes (columns) in tables must have unique names • The order of the columns must be irrelevant • The order of the rows must be irrelevant NOTE: all relations are in 1st Normal form
Correspondence with E-R Model • Relations (tables) correspond with entity types and with many-to-many relationship types • Rows correspond with entity instances and with many-to-many relationship instances • Columns correspond with attributes • NOTE: The word relation (in relational database) is NOT the same as the word relationship (in E-R model)
Key Fields • Keys are special fields that serve two main purposes: • Primary keys are unique identifiers of the relation in question. Examples include employee numbers, social security numbers, etc. This is how we can guarantee that all rows are unique • Foreign keys are identifiers that enable a dependent relation (on the many side of a relationship) to refer to its parent relation (on the one side of the relationship) • Keys can be simple (a single field) or composite (more than one field) • Keys usually are used as indexes to speed up the response to user queries
Primary Key Foreign Key (implements 1:N relationship between customer and order) Combined, these are a composite primary key (uniquely identifies the order line)…individually they are foreign keys (implement M:N relationship between order and product)
Integrity Constraints • Domain Constraints • Allowable values for an attribute. • Entity Integrity • No primary key attribute may be null. All primary key fields MUST have data
Integrity Constraints • Referential Integrity – rule that states that any foreign key value (on the relation of the many side) MUST match a primary key value in the relation of the one side. (Or the foreign key can be null) • For example: Delete Rules • Restrict – don’t allow delete of “parent” side if related rows exist in “dependent” side • Cascade – automatically delete “dependent” side rows that correspond with the “parent” side row to be deleted
Referential integrity constraints (Pine Valley Furniture) Referential integrity constraints are drawn via arrows from dependent to parent table
Transforming ER Diagrams into Relations Mapping Regular Entities to Relations • Simple attributes: E-R attributes map directly onto the relation • Composite attributes: Use only their simple, component attributes • Multivalued Attribute - Becomes a separate relation with a foreign key taken from the superior entity
Mapping a regular entity (a) CUSTOMER entity type with simple attributes (b) CUSTOMER relation
Mapping a composite attribute (a) CUSTOMER entity type with composite attribute (b) CUSTOMER relation with address detail
Multivalued attribute becomes a separate relation with foreign key (b) Mapping a multivalued attribute (a) 1–to–many relationship between original entity and new relation
Transforming ER Diagrams into Relations (cont.) Mapping Weak Entities • Becomes a separate relation with a foreign key taken from the superior entity • Primary key composed of: • Partial identifier of weak entity • Primary key of identifying relation (strong entity)
Composite primary key NOTE: the domain constraint for the foreign key should NOT allow null value if DEPENDENT is a weak entity Foreign key
Transforming ER Diagrams into Relations (cont.) Mapping Binary Relationships • One-to-Many - Primary key on the one side becomes a foreign key on the many side • Many-to-Many - Create a new relation with the primary keys of the two entities as its primary key • One-to-One - Primary key on the mandatory side becomes a foreign key on the optional side
Example of mapping a 1:M relationship Relationship between customers and orders Note the mandatory one
Mapping the relationship Again, no null value in the foreign key…this is because of the mandatory minimum cardinality Foreign key
The Supplies relationship will need to become a separate relation Example of mapping an M:N relationship E-R diagram (M:N)
Composite primary key Foreign key Foreign key Three resulting relations New intersection relation
Mapping a binary 1:1 relationship In_charge relationship
Transforming ER Diagrams into Relations (cont.) Mapping Unary Relationships • One-to-Many - Recursive foreign key in the same relation • Many-to-Many - Two relations: • One for the entity type • One for an associative relation in which the primary key has two attributes, both taken from the primary key of the entity
Mapping a unary 1:N relationship (a) EMPLOYEE entity with Manages relationship (b) EMPLOYEE relation with recursive foreign key
Mapping a unary M:N relationship (a) Bill-of-materials relationships (M:N) (b) ITEM and COMPONENT relations
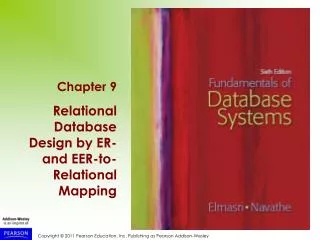
Transforming ER Diagrams into Relations (cont.) Mapping Ternary (and n-ary) Relationships • One relation for each entity and one for the associative entity • Associative entity has foreign keys to each entity in the relationship
Mapping a ternary relationship Ternary relationship with associative entity
Mapping the ternary relationship Remember that the primary key MUST be unique
Transforming EER Diagrams into Relations (cont.) Mapping Supertype/Subtype Relationships • One relation for supertype and for each subtype • Supertype attributes (including identifier and subtype discriminator) go into supertype relation • Subtype attributes go into each subtype; primary key of supertype relation also becomes primary key of subtype relation • 1:1 relationship established between supertype and each subtype, with supertype as primary table
Mapping Supertype/subtype relationships to relations These are implemented as one-to-one relationships
Data Normalization • Primarily a tool to validate and improve a logical design so that it satisfies certain constraints that avoid unnecessary duplication of data • The process of decomposing relations with anomalies to produce smaller, well-structured relations
Normalization Guidelines • Normalization guidelines are a set of data design standards called the normal forms. • Five such normal forms are widely accepted. Matching these standards is known as normalization. • We progress in order from first normal form through to fifth normal form. • Meeting the guidelines means splitting tables into two or more tables with fewer columns. We can use the Primary-key/Foreign-key relationship to join data. • Normalization reduces data redundancy although some duplication is unavoidable.
Definition of a Relation Relation Definition: My-Relation(ID, Status, City). Primary Key My-Relation ID Status City 01 10 London 02 20 Paris 03 20 New York 04 04 Los Angeles Tuples Rows A Cell ( row / column intersection ) Attributes (Columns)
Normalization • Normalization theory is based on the observation that relations with certain properties are more effective in inserting, updating and deleting data than other sets of relations containing the same data • Normalization is a multi-step process beginning with an “unnormalized” relation
Well-Structured Relations • A relation that contains minimal data redundancy and allows users to insert, delete, and update rows without causing data inconsistencies • Goal is to avoid anomalies • Insertion Anomaly – adding new rows forces user to create duplicate data • Deletion Anomaly – deleting rows may cause a loss of data that would be needed for other future rows • Modification Anomaly – changing data in a row forces changes to other rows because of duplication
Example – Figure Question – Is this a relation? Answer – Yes: unique rows and no multivalued attributes Question – What’s the primary key? Answer – Composite: Emp_ID, Course_Title
Anomalies in this Table • Insertion – can’t enter a new employee without having the employee take a class • Deletion – if we remove employee 140, we lose information about the existence of a Tax Acc class • Modification – giving a salary increase to employee 100 forces us to update multiple records • Why do these anomalies exist? • Because there are two themes (entity types) into one relation. This results in duplication, and an unnecessary dependency between the entities
Figure Steps in normalization
First Normal Form • No multivalued attributes • Every attribute value is atomic • Fig. 5-25 is not in 1st Normal Form (multivalued attributes) it is not a relation • Fig. 5-26 is in 1st Normal form • All relations are in 1st Normal Form
Table with multivalued attributes, not in 1st normal form Note: this is NOT a relation
Table with no multivalued attributes and unique rows, in 1st normal form Note: this is relation, but not a well-structured one