Download
1 / 46
460 likes | 469 Vues
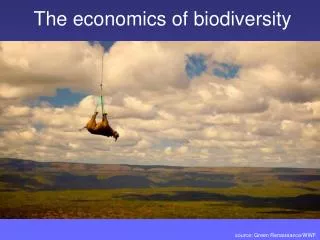
Integrating biodiversity and ecosystems with national accounts. The Economics of Ecosystems and Biodiversity (TEEB). UNCEEA Meetings 24 – 26th June, New York Haripriya Gundimeda co-head D2, study leader group IIT Bombay on behalf of UNEP and Pavan Sukhdev (Study leader). 6/24/2009.

E N D
Integrating biodiversity and ecosystems with national accounts The Economics of Ecosystems and Biodiversity (TEEB) UNCEEA Meetings 24 – 26th June, New York Haripriya Gundimeda co-head D2, study leader group IIT Bombay on behalf of UNEP and Pavan Sukhdev (Study leader) 6/24/2009
TEEB Background The links: Biodiversity, Ecosystems, Functions, Benefits and Value TEEB Phase 1: Results and impacts TEEB Phase 2: Challenges ahead – and how they are approached TEEB Overview 11/7/2019 2
Potsdam 2007: Meeting of the Environmental Ministers of the G8+5 The Starting Point “Potsdam Initiative – Biological Diversity 2010” 1) The economic significance of the global loss of biological diversity In a global study we will initiate the process of analysing the global economic benefit of biological diversity, the costs of the loss of biodiversity and the failure to take protective measures versus the costs of effective conservation. TEEB Background 11/7/2019 3
TEEB’s goals • To mainstream the economics of ecosystems and biodiversity • To review extensively the current state of the science and economics of ecosystems and biodiversity, and recommend a valuation framework and methodology • To address the needs of the “end-users” of these economics : policy-makers, local administrators, corporations and citizens • Source: Pavan Sukhdev, Bonn 2008 • Phase 1 (2007-2008): • Preliminary scoping work, • Some first analysis, • Clarification as to how to address the wider goals, • Preliminary identification of experts and organisations to contribute • Phase 2 (2008-2010): • Valuation framework • Broaden the scope of studies (methods; ESS and biomes addressed) • Focus on End-user products • Stronger Involvement from different experts & organisations 11/7/2019 4
TEEB Background The links: Biodiversity, Ecosystems, Functions, Benefits and Value TEEB Phase 1: Results and impacts TEEB Phase 2: Challenges ahead – and how they are approached TEEB overview 11/7/2019 5
Maintenance and restoration costs Economic and social values (sometimes market values). ‘Final Products’ ‘Intermediate Products’ The link between biodiversity, ecosystems, their services, and benefits to mankind… Source: Jean-Louis Weber (EEA) presentation at the Workshop: The Economics of the Global Loss of Biological Diversity 5-6 March 2008, Brussels, Belgium
Change in Landuse, Climate, Pollution, water use OECD baseline scenario Inter-national Policies Change in biodi-versity Change In ecosystem functions Change in ecosystem services Biodiversity, ecosystems and their services Change in economic value Source: TEEB Interim Report, p.34 11/7/2019 7
TEEB Background The links: Biodiversity, Ecosystems, Functions, Benefits and Value TEEB Phase 1: Results and impacts TEEB Phase 2: Challenges ahead – and how they are approached TEEB overview 11/7/2019 8
TEEB-Interim Report COP-9, Bonn, May 2008 Economic Size & Welfare Impact of Losses Deep Links with Poverty Discount rates are ethical choices 11/7/2019 9
Level of Biodiversity in the World in 2000 (OECD baseline, Globio-3 model, “MSA” indicator) Remaining MSA in % 10 Source: Ben ten Brink (MNP) presentation at the Workshop: The Economics of the Global Loss of Biological Diversity 5-6 March 2008, Brussels, Belgium.
Level of Biodiversity in the World in 2050 “Business as Usual” Scenario of the future Remaining MSA in % • MSA loss from 72% to 61% • Natural Areas decline by 7.5 Million Sq. Km. 11 Source: Ben ten Brink (MNP) presentation at the Workshop: The Economics of the Global Loss of Biological Diversity 5-6 March 2008, Brussels, Belgium.
Main drivers of Biodiversity Loss 2000 - 2050 (Globio-3 ) COPI Figure 4.4a: Contribution of different pressures to the global biodiversity loss between 2000 and 2050 in the OECD baseline 12
Global Loss of Fisheries… …Human Welfare Impact • Perverse Subsidies are a key driver of the loss of fisheries • Half of wild marine fisheries are fully exploited, with a further quarter already over-exploited • at risk : $ 80-100 billion income from the sector • at risk : est. 27 million jobs • but most important of all….. We are fishing down the food web to ever smaller species… at risk : Health … over a billion rely on fish as their main or sole source of animal protein, especially in developing countries. Source: Ben ten Brink (MNP) presentation at the Workshop: The Economics of the Global Loss of Biological Diversity 5-6 March 2008, Brussels, Belgium. Original source: Pauly 11/7/2019 13
Ecosystem Losses & Links to MDG’s … HAITI DOMINICAN REPUBLIC 14
(1) Economic size of losses (COPI 1 study) A : 50-year impact of inaction or ‘business as usual’ B : Natural Capital Loss every year Source: Braat & ten Brink (Eds., 2008): Cost of Policy Inaction Natural Capital Lost : Annually EUR 1.35 x 10¹² to 3.10 x 10¹² (@ 4% (@ 1% Discount Rate) Discount Rate) Welfare losses equivalent to 7 % of GDP, horizon 2050 3. TEEB Phase 1 results 11/7/2019 15
(2) Deep Links with Poverty “GDP of the Poor” most seriously impacted by ecosystem losses… India Example: 480 Million people in small farming, animal husbandry, informal forestry, fisheries … Ecosystem services to classical GDP 7.3 % Ecosystem services to “GDP of the Poor” 57 % Source: GIST’s Green Accounting for Indian States Project, 2002-03 data 11/7/2019 16
(3) Ethics of discounting Three hidden stories Most of the 29 valuation studies in our meta-study of forest valuations use discount rates between 3%-5% Declining Growth Paths in the per-capita flow of nature’s services …imply that discount rates should be negative ! Marginal Utility of $1 to the Rich vs Poor …is too different to merit the same discounting treatment Inter-generational Equity … following ‘market practise’ meansvaluing nature’s utility to your grandchild at one-seventh of your own ! 3. TEEB Phase 1 results 11/7/2019 17
TEEB in the press Collection: UFZ 11/7/2019 18
TEEB Background The links: Biodiversity, Ecosystems, Functions, Benefits and Value TEEB Phase 1: Results and impacts TEEB Phase 2: Challenges ahead – and how they are approached TEEB overview 11/7/2019 19
TEEB from macro to micro TEEB, phase 1 focused on the macro picture TEEB, phase 2 will explicitly address the local, business and consumer level 11/7/2019 20
TEEB – Final ReportsSep 2009 - June 2010 Science & Economics Foundations, Policy Costs & Costs of Inaction D0 Policy Evaluation for Policy-Makers D1 Decision Support for Administrators D2 Business Risks & Opportunities D3 Consumer Ownership D4 11/7/2019 21
The Process for TEEB Phase 2 Inputs from Science and Economics experts through the Call for Evidence, participation in Working Groups, etc D0 D1 D2 D3 D4 End-User Outreach Continuous involvement of End-User Groups 2008 2009 2010 D0 Val‘n Framework, Methodologies, Cost Analyses D1 TEEB for Policy-Makers CBD COP10 Nagoya, Japan CBD COP9 - Bonn, Germany D2 TEEB for Administrators TEEB for Business D3 D4 TEEB for Citizens 11/7/2019 22
The problem $$$ Nature Nature‘s Interactions with Humanity Money : today‘s Yardstick Photo: C.Neßhöver, UFZ 11/7/2019 23
The problem No Value = No Counterweight ... ? ? ? $$$ Nature Photo: C.Neßhöver, UFZ 11/7/2019 24
Improving Measurement can be a long process, but of fundamental importance to being able to obtain a solution (TEEB, D1, chapter 3, work in progress) Important - How we measure what we value? 11/7/2019 25
Spiritual & religious ? Aesthetic ? Economic Valuation Flood/Fire regulation ? Disease regulation Difficult or impossible ? Water purification ? Climate regulation ? Freshwater ? Genetic resources ? Recreation & tourism ? Fiber ? Easy Food ? Economic Value ($) Ecosystem services public goods & difficulty of valuation Source: Jeffrey A. McNeely, Chief Scientist, IUCN-The World Conservation Union from presentaion: FUNDING MECHANISMS FOR BIODIVERSITY. 27 July 2006 Inter-American Development Bank Workshop on Biodiversity Loss
Measuring What we Manage: Towards Proper Stewardship of Our Natural Capital • Range of opportunities to take natural capital into account • Biodiversity indicators: needs for measurement/monitoring, modeling and targets. • Ecosystem services indicators important for instrument design (PES, REDD) • Ecological footprints valuable for policy targets and communication • Critical importance of ecosystem services to the poor – refocus poverty policy? • National policy makers with more comprehensive national income accounts
Five Important Dimensions of “Biodiversity”… • Species Richness ( to quantify species diversity, its recreational, medicinal, etc. values, including contribution to ecosystem resilience and robustness ) • Species Rarity ( to quantify species close to extinction, their ethical and recreational values, global citizens significant ”WTP" for these. Note that Species Rarity is closely and inversely related to another biodiversity attribute, Population Viability, hence a reflection of physical dispersion, mean range size & separation) • Biomass Density ( because of its role in delivering very important services, especially Carbon storage, water provisioning and regulation, and others) • Primary Productivity ( to measure the natural rate of production of biomass, & its food production potential through the human appropriation of net primary productivity - to feed 9 billion of us in 2050) • Genetic diversity ( to quantify bio-prospecting values and insurance values for future foods, etc) 11/7/2019
From indicators to ESS Source; Chapter 3 D0 TEEB work in progress
Ecosystem services indicators • Offer the unique opportunity to describe the flow of benefits provided by biodiversity and ecosystems. • Some examples from D1 TEEB (ten brink et al..) • Provisioning services • Food – Crop production from sustainable [organic] sources in tonnes/ha • Number of wild species used as food • Regulating Services • Climate / climate change regulation (Total amount of carbon sequestered/stored ) • Natural hazards control (Trends in number of damaging natural disasters • Probability of incident) • Water regulation (Infiltration capacity/rate of an ecosystem, Soil water storage capacity in mm/m, Floodplain water storage capacity in mm/m ) • Cultural and social services • Ecotourism & recreation (Number of visitors to protected sites per year, • Amount of nature tourism )
Measuring Benefits of Ecosystem services Answers are needed at all levels Non-Specified Benefits Increasing up the benefits pyramid Monetary: eg avoided water purification costs, avoided flood damage, tourist value, value of medicines / pharmaceuticals from natural products Monetary Value Quantitative: eg level of service, number people benefiting from wood from forests, # of avoided health impacts; number of visitors The Benefits Pyramid Quantitative Review of Effects Type of benefits; health benefits from clean air, social benefits from recreation, income from products, security, wellbeing. Qualitative Review Knowledge gaps The “known-unknowns” and “unknown-unknowns” Full range of ecosystem services from biodiversity Source: P. ten Brink: presentation at March 2008 workshop Review of Economics of Biodiversity Loss, Brussels
07.11.2019 32 UNEP ETB
Our Economic Space… and our Economic Compass… GDP Growth • Natural Capital • Human & Social Capital • Financial & Physical Capital 33
Sustainable measurement need of the hour • Economic assets – Natural assets • Infrastructure – Green infrastructure • Gross fixed capital formation – Natural capital formation • Trade deficits – Green deficits • National net savings – Genuine savings • National Accounts – Satellite Accounts for nature • GDP – EDP • There is a natural counterpart to many of our economic measures, which is equally important, yet we do not take it into account. This must change to achieve true sustainable development (TEEB, D1, Chapter 3)
Integration of ecosystems into national accounts - vital • Compute ecosystem asset accounts • Compute the loss in flows due to capital consumption • Derive Adjusted net domestic product/income • Integrate ecosystem accounts with the national accounting matrices and the monetary and physical indicators used for policy making.
Example from India GAISP project for forests • Opening stocks • Changes due to economic activities • Other Changes • Closing stocks Detailed components for forestland, timber and carbon are slightly different for each Total economic value (Timber, fuelwood, fodder, nontimber forest products, carbon, ecotourism and biodiversity) Monetary accounts
GDP of the poor • A ‘tale of two tragedies’ for mixed economies pursuing a traditional GDP-growth-led development paradigm. Gundimeda and Sukhdev, D1 TEEB
GDP of the poor Source: Gundimeda and Sukhdev D1 TEEB
Consumer Theme : Ecological Footprints - Land and Water use by various foods 11/7/2019 42
“Society must urgently replace its defective economic compass so that it does not jeopardize human well-being and planetary health through the under-valuation and consequent loss of ecosystems and biodiversity.” Pavan Sukhdev, TEEB Study Leader 29.5.2008, CBD COP9 Message from TEEB 11/7/2019 43
Message from TEEB community • Qualitative indicators are an important tool in underlying quantitative and monetary information and help to close gaps where no such information exists. • Economic values are critical means of communicating urgency, addressing need of action or designing effective policy instruments. • Greening the national accounts are necessary to correct defective economic compass • Indicators like GDP of the poor are also necessary to analyse the vulnerability of poor people to environmental degradation. For transitional economies where rural and forest-dweller poverty is a significant social problem, we advocate using a measure of GDP which is sectoral and focused on their livelihoods : we call this “GDP of the poor”. • Beyond GDP indicators important for policy targets and communication • For TEEB each aspect is important – integration into the national accounts, monetary indicators, the quantitative and the qualitative.
Recommendations for UNCEEA • Three methods recommended - Green National Accounting ; Genuine Savings ; Inclusive Wealth - all require stock adjustments • Flow adjustments also needed, and reflected against GDP for Governments, to stop using GDP as the only progress indicator • SEEA-2003 revision to become a more comprehensive "guidebook" • Countries who can move ahead should do so... • The Key here is to set the direction , not try to dictate the speed at which countries migrate to 'Green Accounting' • Therefore ....a Tier 1 should form of countries who can simultaneously do ecosystem accounting etc and prepare comprehensive Green Accounts ( eg : India). • Tier 2 should be countries who can do some, not all, the key recommendations. • Tier 3 are those for whom WB or UN just has to make their own spreadsheet estimations of value adjustments
Thank You ! 11/7/2019