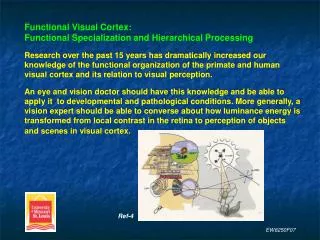
EW8250F07
Color Vision – 4 History, Theory, Mechanisms, Pathways, Deficits, Tests Readings: Schwartz Chapter 5 – 6, some Functional Retina. Ref-1. EW8250F07.

EW8250F07
E N D
Presentation Transcript
Color Vision – 4History, Theory, Mechanisms, Pathways, Deficits, TestsReadings: Schwartz Chapter 5–6, some Functional Retina Ref-1 EW8250F07
Bezold-Brucke PhenomenonThe hue of most monochromaticwavelengths change slightly withdifferent levels of luminance.Measurement:Bipartite field.Right hemifield (c) reference(constant luminance and ).Left hemifield (v) test(subject varies wavelength).Initially both fields are identical.Luminance of v is gradually increased (for most wavelengths its hue gradually shifts).Subject adjusts v wavelengthso that it remains the same hueas c. “Keep it a constant color” Ref-2 EW8250F07
Tilted lines are hue contour lines.They show the wavelengths that keeps a constant hue (to the reference) with increasing luminance.The 3 invariant wavelengths are478 nm, 503 nm and 578 nm.These are also called invariantpoints or unique hues. They lookpure in that they do not appear tobe mixed with another wavelength. 478 nm = unique blue 503 nm = unique green 578 nm = unique yellow Ref-2 EW8250F07
Summary Rule for Contour Lines:With increasing luminance, wavelengths below 503 nm shift in appearance towards blue (478 nm), and wavelengths above 503 nm shift in appearance towards yellow (578 nm).Examples490 nm (blue-green) appears bluer sov is changed to longer wavelengths, and the contour line tilts to the right.450 nm (violet) appears bluer sov is changed to shorter wavelengths,and the contour line tilts to the left.525 nm (green) appears yellower sov is changed to shorter wavelengths,and the contour line tilts to the left. Ref-2 EW8250F07
Data and Y-axis Values (Norton):Invariant points (478, 503 & 578 nm)are close but not perfectly invariant.Shift amount varies (not straight line) with the amount of luminance change (2 log unit (100x) tested!):increase with increasing luminance.Shift amount increases dramaticallywith increasing wavelength. Ref-1 EW8250F07
Underlying Neural MechanismLikely color opponent mechanism: increasing luminance will produce color adaptation for that hue and the opponent color then dominates.Thus test wavelengths < 503 nm will result in the blue opponent color (426 nm) dominating (appear bluer).And test wavelengths > 503 nm willresult in the yellow opponent color, i.e. more red component or moregreen component, dominating (appear more yellow). Ref-1 EW8250F07
Munsell Color Appearance SystemOne of several systems developedto specify colors.Used in the art and paint industry.Every color has three attributes:hue (H), value (V) and chroma (C).Hue: similar to wavelength bandValue : similar to brightnessChroma: similar to saturationMunsell created numerical scales and visually uniform steps for each attribute; designated H V/C.H, V and C represent 3-dimensions of color, hence are shown in acylinder-like volume. Ref-2 EW8250F07
Munsell Color Appearance SystemThese colors are presented in a Book of Color as chips.The color of any surface can be identified by comparison to the chips then assigned a H V/C value.The 3-dimensions are often represented as a color solid. EW8250F07
Design of the Munsell Color Appearance System.The three attributes (dimensions) of color are perceptual attributes. Hue = perimeter, 10 wavelength bands (RYGBV), 0 – 100 Value = top to bottom in center, brightness 0 – 10 Chroma = radius, saturation, 0 – 14 (some 0 – 30) EW8250F07
Example H V/C for vivid red: 5R 6.2 / 13.5 (wavelength, brightness, saturation The Munsell Color Appearance System is widely used in industry, i.e. the public. EW8250F07
The Munsell System is the basis for the Farnsworth-Munsell 100-hue test (85 cap test) and 15 cap tests. The cap colors are taken from the 100 possible hues of the Munsell color ordering system. 15 cap test 85 cap test Ref-1 EW8250F07
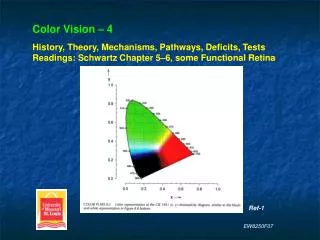
CIE Color Specification SystemLike the Munsell System, it is designed to specify colors. However, this system is used in vision research and for clinical applications.Based on trichromatic vision: any color is specified by the relative amounts of a mixture of three primary colors.It is a system of imaginary primaries (X, Y and Z) developed because of the difficulty in using red, green and blue primaries. Ref-1 EW8250F07
RGB difficulty(A) Bipartite field matching paradigm. One test wavelength to be matched by 3 primary wavelengths.(B) Y-axis Tristimulus Value (amount of each primary required in a match) is negative for red between 450 nm and 550 nm (red is not needed to produce blue-green colors). This means that red was added to the test wavelength to achieve a match.(C) Chromaticity diagram plots data from (B) and shows the negative values for red.The CIE System was developed toovercome these negative values. Red Green blue Ref-2 EW8250F07
RGB Primaries ---> XYZ PrimariesMatrix algebra converts color matching data of real (R, G and B) primaries into color matching functions for imaginary (X, Y and Z) primaries.(A) Conversion plot shows no negative values for x (real Red) at 450–550 nm.(B) Chromaticity plot shows no negative tristimulus values. This plot is called the CIE Chromaticity Diagram.Note that (B) converts tristimulus valuesinto relative values (0 – 1). These relativevalues are the amounts of each primaryrequired to match any real color.Continued… Red Green blue Ref-2 EW8250F07
CIE Chromaticity DiagramNote that (B) converts tristimulus valuesinto relative values (0 – 1). These relativevalues are the amounts of each primaryrequired to match any real color.Relative values for the z primary?Tristimulus Values (A): upper case.Chromaticity Coordinates (B): lower case.x = X / (X + Y + Z)y = Y / (X + Y + Z)z = Z / (X + Y + Z)so (x + y + z) = 1Since the chromaticity coordinates sum to 1, only two coordinates need to be known. Thus x and y are plotted and z is simply calculated from 1 – (x + y). Ref-2 EW8250F07
Basic AttributesWithin the CIE Chromaticity Diagramare all the physically realizable colors.Outside the diagram are the imaginary primaries (X, Y and Z) because they arenot physically realizable.White, W, is at the center of the diagram.Monochromatic hues, also called spectral hues, are pure (saturated) colors and fall along the arc of the diagram perimeter. This arc is called the spectral locus.Purples, a non-spectral hue, fall along a straight line connecting 400 – 700 nm. This is because purple must be produced by mixtures of blue and red. Ref-2 EW8250F07
Note how combinations of chromaticity coordinates produces specific colors. EW8250F07 Ref-2
Calculating Color MixturesConnect two colors. On that line mark the color ratio (point M).Connect M to White, W, and extend to the arc.Arc intercept is the dominant wavelength.Ratio of (W to M) / (W to arc intercept) = excitation, or colorimetric, purity. Ref-2 EW8250F07
Calculating Color MixturesConnect two colors. On that line mark the color ratio (point M).Connect M to White, W, and extend to the arc.Arc intercept is the dominant wavelength.Ratio of (W to M) / (W to arc intercept) = excitation, or colorimetric, purity. The values provided and calculated in both of these examples are approximate and thus are generally impractical for exams. Nonetheless, they demonstrate how the CIE Diagram works and a useful application, if performed with software. Ref-2 EW8250F07
The CIE Diagram is useful for determining a color’s complement,i.e. the color that when mixed together in the correct proportion produces white. Connect the wavelength through white, W, to the opposite side of the Diagram. 480 nm and 580 nm are complimentary colors. Ref-1 EW8250F07
The location of white is determined by the color temperature ofthe illuminant (Standard illuminants A, C, D65, etc.).The arc formed by these illuminants is called the Planckian locus. Production of sample H depends on the illuminant. All variants of white. Ref-2 Ref-1 EW8250F07
Protanope (17) Deuteranope (27) Tritanope (10) CIE Diagram Color Confusion Lines Lines connecting points which appear identical in color to dichromats. The space between confusion lines represent a noticeable change in wavelength. The greater the number of confusion lines, the greater the wavelength discrimination ability. EW8250F07
CIE Diagram Color Confusion Lines Similar Different Ref-2 Ref-1 EW8250F07
CIE Diagram and the D15 and 100-hue Cap Tests 15 cap test 85 cap test Ref-1 Ref-2 EW8250F07
D15 Cap Test: Color Locations and Example Deficits Ref-1 EW8250F07
CIE Diagram and the Anomaloscope Protanope (17) Deuteranope (27) Ref-2 EW8250F07
CIE Diagram and the Anomaloscope EW8250F07
Color LabelingAnomalous trichromats do show poor labeling relative to trichromats.Nice diagram showingthe differences betweenanomalous trichromatsand dichromats.Note high ability areasin normal trichromats.‘Variable’ means that colors are labeled based on brightness (luminance) and context or shape cue, and not by wavelength discrimination.Things to keep in mind when counseling children and adults. Ref-2 EW8250F07
ColorLabeling Ref-2 EW8250F07
Color Labeling Ref-2 EW8250F07
Different Functions Have Common Mechanisms. One example. Color Labeling Wavelength Discrimination V Function Shifts EW8250F07
References1. Norton, T., Corliss, D., & Bailey, J., 2002. The Psychophysical Measurement of Visual Function. Butterworth Heinemann.2. Schwartz, S., 2004. Visual Perception: A Clinical Introduction, 3rd Ed. McGraw-Hill.3. Snowden, R., Thompson, P., & Troscianko, T. 2006. Basic Vision: An Introduction to Visual Perception. Oxford.4. Palmer, S., 1999. Vision Science – Photons to Phenomenology. Massachusetts Institute of Technology.5. Rodieck, R. 1998. The First Steps In Seeing. Sinauer.6. Daw, N. 2006. Visual Development, 2nd Ed. Springer.7. Kaufman, P., & Alm, A. (Eds.). 2003. Adler’s Physiology of the Eye, 10th Ed. Mosby.8. Hubel, D. (1995). Eye, Brain and Vision. Scientific American Library.9. Oyster, C. 1999. The Human Eye: Structure and Function. Sinauer. EW8250F07