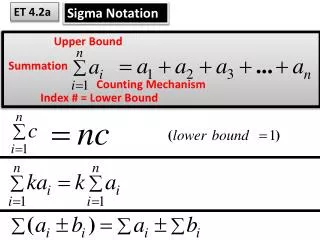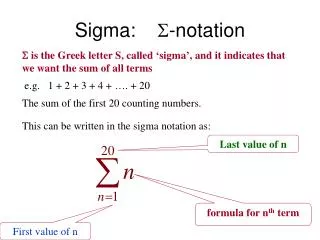
Sigma Notation
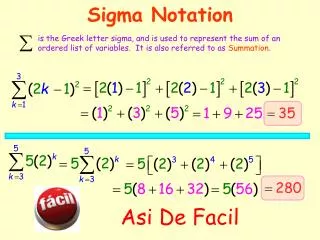
Sigma Notation. is the Greek letter sigma, and is used to represent the sum of an ordered list of variables. It is also referred to as Summation. Asi De Facil. JUN05 23. Regents Questions. DefCon 2. AUG04 18. DefCon 1. Asi De Facil. Comparing Statistical Data. Mean. Median. Mode.

Sigma Notation
E N D
Presentation Transcript
Sigma Notation is the Greek letter sigma, and is used to represent the sum of an ordered list of variables. It is also referred to as Summation. Asi De Facil
JUN05 23 Regents Questions DefCon 2 AUG04 18 DefCon 1 Asi De Facil
Comparing Statistical Data Mean Median Mode The middle score or number when they are in ascending order. The average of a set of scores or data. The score or number that appears most often. The Mean, Median, and Mode are measures of Central Tendency because they indicate where the data are centered. Range Standard Deviation A statistic that measures how far apart the individual scores or numbers are from the mean. The difference between the largest and the smallest score or number. The Range, and Standard Deviation are measures of Dispersion because they indicate how spread out the data are.
Calculating Standard Deviation A) Calculate the standard deviation of set A = {49, 53, 51, 55} B) Calculate the standard deviation of set B = {1, 2, 5, 200} Store the data in L1 Press STAT > (CALC) ENTER (1-Var Stats) ENTER 2nd L2 ENTER For set B the standard deviation is large compared to the mean which suggests that the individual numbers vary widely from the mean.
Grouping Data The accompanying table represents the test scores of 30 math students. • Find the mean score and the standard deviation, correct to the nearest tenth. • Find the % of the class that had scores more than one standard deviation above the mean. • What is the probability that a score picked at random will fall within one standard deviation of the mean? a) Enter the grades in L1 and the frequency in L2 Press STAT > (CALC) ENTER (1-Var Stats) 2nd L1 , 2nd L2 ENTER b) One standard deviation above the mean would be any grade higher than 91.2 (79.5 + 11.7). There are 6. c) Within one standard deviation of the mean would be any grade higher than 91.2 (79.5 + 11.7) or lower than 67.8 (79.5 - 11.7). There are 15.
Standard Normal Curve Percentiles 0.1st 2nd 16th 50th 84th 97th 99th
Standard Normal Curve Example The mean score on a standardized test was 483, and the standard deviation was 97. If 10,000 students took the test, approximately how many students had scores from 386 to 580? 386 483 580 That was easy Approximately 6,820 students had scores from 386 to 580.