Diffusion & Interventions
Diffusion & Interventions. Diffusion of innovations Behavior change Behavior change is short term whereas diffusion looks at the long view of how new behaviors spread. 1. Diffusion of Innovations.

Diffusion & Interventions
E N D
Presentation Transcript
Diffusion & Interventions Diffusion of innovations Behavior change Behavior change is short term whereas diffusion looks at the long view of how new behaviors spread 1
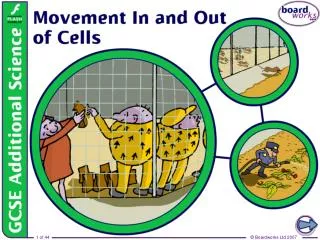
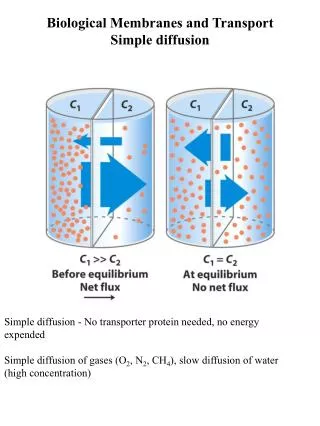
Diffusion of Innovations New ideas and practices originate enter communities from some external source. These external sources can be mass media, labor exchanges, cosmopolitan contact, technical shifts and so on. Adoption of the new idea or practice then flows through interpersonal contact networks. 2
Diffusion of Innovations • Rogers wrote consecutive texts on this topic: • 1962 1st Edition • 1971 2nd Edition (with Shoemaker) • 1983 3rd Edition • 1995 4th Edition • 2003 5th Edition • Synthesized, elaborated, codified, explained diffusion of innovations 3
ELEMENTS OF THE DIFFUSION OF INNOVATIONS 1) The rate of diffusion is influenced by the perceived characteristics of the innovation such as relative advantage, compatibility, observability, trialability and complexity, radicalness, and cost. 2) Diffusion occurs over time such that the rate of adoption often yields a cumulative adoption S-shaped pattern. 3) Individuals can be classified as early or late adopters. 4) Individuals pass through stages during the adoption process typically classified as (1) knowledge, (2) persuasion, (3) decision, (4) implementation or trial, and (5) confirmation. 4
Characteristics of an Innovation Relative advantage Compatibility Complexity Trialability Observability Cost Radicalness 5
4 Elements according to Rogers • Innovation: An idea or practice perceived as new • Perceived attributes: relative advantage, compatibility, complexity, trialability, observability • Communication channels • Homophily vs. heterophily • Time: at the individual & macro levels • Social system 6
Hypothetical Cumulative and Incidence Adoption Curves for DiffusionHomogenous Mixing 7
Diffusion Takes time Is difficult even when something is seemingly worthwhile Is guided and influenced by many factors, some obvious, some not so obvious Provides a macro – micro perspective on behavior change 10
Diffusion Process by which an innovation is communicated through certain channels over time among the members of a social system Communication is special in that it attempts to reduce uncertainty about the innovation Diffusion vs. Dissemination vs. Technology Transfer 11
Hypothetical Diffusion When Adopters Persuade Non-adopters at a Rate of One Percent(Homogenous Mixing) 13
Hypothetical Cumulative and Incidence Adoption Curves for DiffusionHomogenous Mixing 14
The Diffusion of Knowledge, Attitudes and Practices (KAP) 15
The Two-Step Flow Hypothesis of Mass Media Influence Friends Family Mass Media Opinion Leaders Coworkers Others 17
Mathematical Models Used to Derive Diffusion Rate Parameters 18
History Early pre-paradigmatic research by Anthropologists, Economists, & Sociologists interested in cultural change (1903-1940) In 1943, Ryan & Gross published a study farmers’ adoption of hybrid seed creating the paradigm By 1962 Rogers published “Diffusion of Innovations” which solidified the paradigm Coleman, Katz & Menzel’s (1966) study of Medical Innovation solidified the theory on diffusion networks 19
Ryan & Gross Studied the diffusion of hybrid seed corn, retrospectively 1928-1941 2 communities in Iowa, 255 of 257 farmers adopted Contrasted economic and social variables Established diffusion paradigm 20
Diffusion Publications and Research Innovations:Ratio of Innovations to Publications Remained Constant 22
Reasons for Decline It was perceived as fallow intellectually (15 of 18 variables used by Ryan & Gross) Political climate was against cultural imperialism. It was politically incorrect – associated with technological hegemony Environment suffered from the spread of technological innovations (pesticides, herbicides) Social scientists not trained in matrix methods to investigate network reasons for diffusion 23
Research on Innovation Diffusion in Many Fields In Demography and fertility transition studies In Sociology by re-newed attention on diffusion networks In Communication as a tool to evaluate communication campaigns In Organizations as a means to understand and plan change 24
Diffusion Networks A specific branch and approach to diffusion study Some might argue that diffusion is only diffusion when one looks at networks and that other “diffusion” studies are behavior or social change Diffusion networks has been historically the branch of networks focused on behavior change 25
Lineage of Diffusion Network Models From Valente (2006) • Type (1) Social integration • Social Factors are important - Ryan & Gross 1943 • Social Integration - Coleman Katz & Menzel 1966 • Opinion Leaders - Rogers 1964 • Norms - Becker 1970 • Rogers & Kincaid 1981 • Type (2) Bridges & Structure • Weak Ties - Granovetter 1973 • Burt 1987 1992 • Watts (2002) 26
Lineage (cont.) Type (3) Critical levels • Schelling 1972 • Thresholds - Granovetter 1978 • Critical Mass - Marwell, Oliver et al. 1988; Markus 1988 • Network Thresholds - Valente 1995/1996 Type (4) Dynamics • Marsden & Polodny 1990 • Spatial & Temporal Heterogeneity – Strang & Tuma, 1995 • Valente 1995 2005 27
(1) Social Integration/ Opinion Leaders Integration can be measured many ways Behavior is a function of being embedded within a/the community Usually operationalized as receiving ties 28
Coleman Katz & Menzel 1966 Actually 1957 was first paper Data collected 1955-1956 Interviewed all MDs in 4 Illinois cities: Peoria, Bloomington, Galesburg, & Quincy Sampled prescription records first 3 days of each month to measure Time of Tetracycline Adoption 29
Diffusion of Tetracycline for Marginal versus Integrated Doctors 30
Diffusion Network Simulation w/ 3 Initial Adopter Conditions (Valente & Davis, 1999) 31
Diffusion Network Game • Distribute red, white & blue chips • Give: • Red to OLs • Blue to Randoms and • White • Allow them to give chips to those people who nominated them 32
Diffusion Network Game • Distribute Red, White & Blue Chips to different initial starts • Red = awareness • White = attitude • Blue = behavior • Can only receive a white chip if have red one; only receive a blue one if have red & white 34
(2) Structural Structural models require data from the entire network Can use sociometric data to identify bridges Can also use to measure structural equivalence and constraint 36
Granovetter, Strength of Weak Ties (1973), AJS Seminal article Cited thousands of times Granovetter was White’s student First faculty appointment at JHU Left JHU for Stonybrook, now at Stanford 37
Granovetter, Strength of Weak Ties (cont.) C The Forbidden Triad A B C If A & B are linked and A & C are linked then it implies that C & B are linked A B Cognitive balance inclines friends of friends to know friends - transitivity. Granovetter shows Figure 1 which is the forbidden triad, i.e., this type of network configuration rarely occurs. 38
SWT: Bridges created shorter paths H I G D J F C A B K E L Weak Tie Bridges - individuals who link otherwise disconnected sub-groups. Individuals who act as bridges have weak ties. So a bridge is composed of weak ties, but not all weak ties are bridges. 39
(3) Critical Levels Tipping points Macro vs. micro tipping points, critical mass vs. thresholds Most CM/threshold models were not explicitly social network explanations 40
(4) Dynamics Can model how ideas/behaviors spread through a network Simplest model assumes static (fixed) network and the idea spreads on that network Start with initial adopters and let the behavior percolate through the network 41
Network Exposure = Non User =User Exposure=33% Exposure=66% Exposure=100% 42
Exposure Equation where E is the exposure matrix, S is the social network, A is the adoption matrix, n is the number of respondents, n+ indicates the sum of each row, and t is the time period. The exposure equation is a very general model in which the social network can be direct relations, positional relations, narrowly focused, or broadly focused. 43
Computing Network Weighted Scores Such as Network Exposure Nx1 Vector of Row Totals Nx1 Vector of Scores Nx1 Vector of Network Weighted Scores 1 2 3 4 …………...……….N 1 2 3 4 ………….….N N x N Adjacency Matrix (or weight matrix) X = – : 44
Computing Network Weighted Scores Such as Network Exposure Nx1 Vector of Row Totals Nx1 Vector of Scores Nx1 Vector of Network Weighted Scores 1 2 3 4 …………...……….N 1 2 3 4 ………….….N 0 1 0 1 0 …. 1 0 1 0 0 …. 0 1 0 1 1 …. 1 0 0 0 1 …. 1 0 0 1 0 …. . . 1 0 1 1 0 . . 2 2 3 2 2 . . .5 1.0 .33 .5 1.0 . . X = – : 45
NxT Matrix of Exposure Scores 1 2 3 4 …………...……T 1 2 3 4 ………….….N 0.00 0.25 0.50 0.50 ... 0.00 0.00 0.00 0.00 …. 0.00 0.00 0.00 0.00 …. 0.25 0.25 0.25 0.25 …. 0.33 0.33 0.66 1.00 …. . . 46
4. Personal network exposure Personal network exposure is the degree an individual is exposed to an innovation through his/her personal network. Network exposure provides: 1. awareness information 2. influence/persuasion 3. detailed information on how to get the innovation, possible problems, updates, refills, enhancements, novel uses 4. something to talk about 47
Network Exposure (cont.) 5. social support needed to face opposition 6. reinforcement and a sense of belonging 7. relay experiences Exposure computed on direct ties; and on ties of ties by using the geodesic and weighing the ties by its inverse. Every network has a different maximum geodesic measure so we need to approximate the influence of any one point on any other point. Luckily the flow matrix has been created which does precisely that. 48
Three Studies with Data on Time-of-adoption & Social Networks 49
Datasets Provide static view of network 1 based on observational data on adoption (but it is sampled) 2 based on recall- though recall is probably pretty good They are varied and the network data are pretty good 50