Changes in Schedule and Summary of Effect Size Analysis with Data Visualizations
The analysis schedule has been adjusted with the first draft now due on August 19th. This document provides a comprehensive overview of the average effect sizes (ES) from the data collected, presented via various charts and tables including stem-and-leaf and funnel plots. Key metrics include weighted and unweighted effect sizes, heterogeneity tests, and fail-safe N calculations, which assess the robustness of effect sizes against unpublished studies. Moreover, moderators are analyzed to interpret how different factors influence results.

Changes in Schedule and Summary of Effect Size Analysis with Data Visualizations
E N D
Presentation Transcript
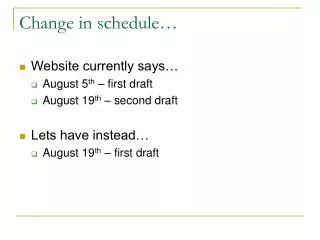
Change in schedule… • Website currently says… • August 5th – first draft • August 19th – second draft • Lets have instead… • August 19th – first draft
Overall Strategy (1) Average ES • In-text: • Average, range, total number • Heterogeneity • Fail-safe N • Unweighted (and difference test to weighted) • Outliers (and difference test to weighted after removing outliers) • Charts/Tables: • Descending order • Stem-and-leaf • Funnel Plot • Boxplot
(1) Average ES: in-text • The average weighted effect size was .1221 (CI = .1139, .1302, z = 29.07, p< .001). • The range of effect sizes is .78 to -.61 across 296 total effect sizes. • The heterogeneity test for the weighted effect size was significant (Qw (293) = 1145.87, p< .001), indicating that there was substantial variation within the weighted effect sizes.
(1) Average ES: in-text • A fail-safe N was calculated to ascertain the number of new, unpublished, or unretrieved studies required to reduce the significance of this averaged effect size to non-signifcance (Rosenthal, 1991), fail-safe N = 108,195. • page 104-105 for Rosenthal, 1991
(1) Average ES: in-text • A fail-safe N can also be calculated to ascertain the number of new, unpublished, or unretrieved studies required to reduce this averaged effect size to a specific level (Lipsey & Wilson, 2001). To reduce the averaged effect size to a specified level of .1, the fail-safe N = 65, which indicates that it would take an additional 65 studies with an effect size of 0 to reduce the current meta-analyzed effect size of .1221 to .1. To reduce the average effect size to a specified level of .05, the fail-safe N = 424. To reduce the average effect size all the way to 0, the fail-safe N = 358,680. • Page 166 of Lipsey/Wilson
(1) Average ES: in-text • Unweighted • “The unweighted effect size average is .1451 (CI = .1339, .1563, z = 25.14, p< .001). “ • Difference Test to Weighted • “The test of the differences between the two dependent effect sizes was non-significant, z = .41, p = .69. In other words, the weighted effect size was not influenced by particular sample sizes that were extremely large or small. “ • http://faculty.vassar.edu/lowry/rpop.html
(1) Average ES: in-text • Outlier analysis • “Outlier analysis determines the existence of extreme effect sizes, as compared to the analysis above which tested the influence of extreme sample sizes. Chart 3 shows the boxplot for the weighted effect sizes.” • “Eliminating the outliers produces a weighted effect size of .1137 (CI = .1054, .1219, z = 26.89, p< .001).” • Difference test to weighted after removing outliers • “The test of the differences between the weighted effect sizes with and without the outliers was non-significant, z = .15, p = .88. Thus, the weighted effect size was not significantly influenced by outliers.”
Overall Strategy (2) Moderators • In-text: • Interpreting the data and comparing/contrasting • Charts/Tables: • ES of Moderators • Categorical Moderator Data • Continuous Moderator Data • 95% Error Bar Chart • Multivariate Data