Download
1 / 13
170 likes | 456 Vues
Levelized Cost of Energy. Summary. RPS Calculator Valuation Framework. Levelized costs are calculated as a proxy for the PPA price between a third-party developer and a utility

E N D
Summary RPS Calculator Valuation Framework • Levelized costs are calculated as a proxy for the PPA price between a third-party developer and a utility • LCOEs amortize all capital and operating costs incurred over the plant’s economic lifetime, accounting for tax impacts and tax credits + Levelized Cost of Energy + Transmission Cost − Capacity Value − Energy Value + Integration Cost* = Net Resource Cost *Not currently quantified in RPS Calculator
Levelized Cost of Energy • Calculation of LCOEs has been adjusted to incorporate plausible changes over time for projects that come online in the future Versions 2.0 – 5.0 • Renewable LCOEs calculated based on cost and performance of present-day technology Version 6.0 • Renewable LCOEs calculated for each year to incorporated changes over time: • Capital costs • Financing costs • Tax credits and benefits
Translating Resource Cost & Performance to LCOEs Resource Cost & Performance • RPS Calculator pairs cost & performance assumptions modeled by B&V with a simple pro-forma financing model to calculate the levelized cost of energy for each generating technology Capital Cost Fixed O&M Variable O&M Fuel Cost Capacity Factor Degradation Pro-Forma Cash Flow Model Levelized Resource Costs (cost-based PPA prices) RPS Calculator Financing & Tax Inputs Cost of Capital Capital Structure Tax Credits MACRS Financing Life
Pro Forma Parameters • Pro-forma cash flow model accounts for: • Capital investment cost and the availability of debt and equity financing • Operating and maintenance costs • Federal and state income taxes • Tax benefits of accelerated depreciation • Federal tax credits for renewable resources • The price calculated is sufficient to cover operating costs, provide sufficient debt service coverage, and ensure an adequate return of and on equity to investors • Minimum debt service coverage ratio of 1.40
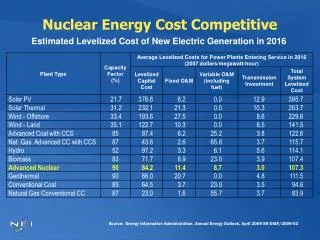
Key Inputs • The table below summarizes the key technology-specific input assumptions for resources installed in 2013: • Assumes all resources must meet a minimum DSCR of 1.40 • Federal and state income tax rates are 35% and 7%, respectively * Higher cost of capital for solar PV is assumed due to the longer financing lifetime
Modeling Future Changes in LCOEs • Estimating future costs of renewable resources is a challenging exercise, as many of the factors that will affect prices are surrounded by large uncertainty • Most significant levers to our estimates: • Capital cost reductions: technological improvement over the coming decades may drive renewable resource costs down • Long run financing:projects financed in the future will not benefit from the low-cost financing available in today’s low interest rate environment, which is inconsistent with long-run macroeconomic projections of inflation • Bonus depreciation: the eligibility of projects to claim bonus MACRS depreciation ends after 2013 • Property tax exemption: the exemption of solar facilities from California property tax is not available to facilities installed after 2016 • Federal tax credit sunsets:in 2017, the ITC reverts from its current level (30%) back to 10%; the PTC for renewable resources is currently scheduled to expire at the end of 2013 • Assumption: credits and subsidies will expire as currently stated by law • One exception: Assumes PTC applies to all projects constructed by 2017 (same lifetime as ITC)
Capital Costs Over Time • LCOE calculations integrate projected capital cost trends developed by Black & Veatch • Relatively stable for more mature renewable technologies • Cost reductions shown for emerging technologies
Trajectories of Resource Costs • Long-term trajectories of PPA prices reflect input assumptions: • Near-term price increases are driven by expiration of tax benefits and credits, increase in financing costs • Over a longer period, reductions in capital costs continue to translate to declining PPA prices for emerging technologies
Drivers of Cost Changes Over Time • Based on assumed capital cost reductions and the proposition that tax credits will not be renewed, future renewable costs will be higher than today
Summary of LCOEs Over Time • Future increases in costs are driven by expiration of tax credits & benefits, which are partially offset for some technologies by capital cost reductions • All costs expressed in 2013 dollars • LCOEs presented represent a plant with ‘average’ cost and performance attributes for each technology
RPS Calculator Guide • The parameters that affect resource LCOEs can be found on the following tabs: • Resource_Char: cost and performance input assumptions for each major category of renewable technology • Pro_Forma: financial model of a cost-based PPA between utility and third-party developer used to calculate LCOEs used in RPS Calculator • Resource_Cost: results of LCOE calculations for each technology and each installation vintage (2013-203), expressed by component • Results hard-coded by macro