Global Warming and Climate Change
850 likes | 1.39k Vues
Global Warming and Climate Change. David M. Bush Risk Assessment GEOL 4093. What’s going on?. or. Two big questions:. Is Earth warming? Are we to blame?. What is climate ?. “Climate is what you expect, weather is what you get” 100-year average state of the atmosphere

Global Warming and Climate Change
E N D
Presentation Transcript
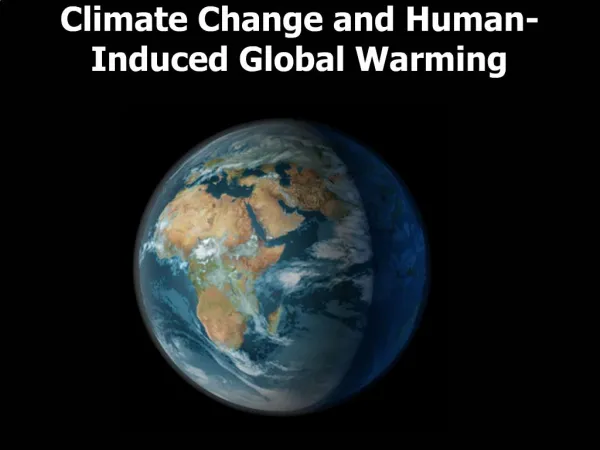
Global Warming and Climate Change David M. Bush Risk Assessment GEOL 4093
Two big questions: Is Earth warming? Are we to blame?
What is climate? • “Climate is what you expect, weather is what you get” • 100-year average state of the atmosphere • Excludes variations occurring within a human lifespan
This is weather, not climate cartoonaday.com
The Greenhouse Effect NASA graphic
Greenhouse Effect: Good or Bad? Earth “Just Right” Atmosphere 15 oC 59oF Mars “Too Thin” Atmosphere -63 oC -81oF Venus “Too Thick” Atmosphere 464 oC 867 oF Average surface temperatures NASA photos and data
First Big Question Is Earth Warming?
Two billion years of temperature change Big picture: cycles of warm and cool periods. Warm conditions often called “Hothouse” like age of dinosaurs. Cool periods called “Icehouse” like now. http://www.scotese.com/climate.htm
What caused all these changes? • Tectonic forcing • Change in size and location of continents • Opening and closing of oceanic gateways • Uplift and erosion of mountain belts • Volcanism • Astronomical forcing • Change in solar output • Change in Earth’s orbit (Milankovich Cycles) • Humans obviously not to blame for these
90 Ma On long time scales, plate tectonics plays major role in climate change Plate tectonics moves landmasses which affects Earth’s reflectivities, temperatures of land versus ocean, and global atmospheric circulation. DeConto (2009). Today Ron Blakely, NAU, http://www2.nau.edu/rcb7/
Change in solar output, though small, may account for 25% of global warming. Decreased sunspot activity correlates with lower solar luminosity. May be responsible for Little Ice Age
It is now commonly believed that ice ages are caused by variations in the amount of solar energy hitting Earth which is controlled by predictable astronomic variations called Milankovich Cycles. Work over 90,000 to 100,000 year scale
2 thousand years Black line = Instrumented data "Image created by Robert A. Rohde / Global Warming Art"
1880-2004 "Image created by Robert A. Rohde / Global Warming Art"
Second Big Question Are we to blame?
How do you take Earth’s temperature? Where do you stick the thermometer? Global observations show trends!
Northwestern Glacier in Kenai Fjords National Park, Alaska Photograph by Bruce F. Molnia, USGS Photograph by Ulysses S. Grant Robert A. Rohde, Global Warming Art
The Evolution of the Rhone glacier from 1850 until today. Swiss Institute of Technology.
95% of alpine glaciers are retreating Robert A. Rohde, Global Warming Art
2007 was record-breaking Arctic sea ice minimum Image created by Robert A. Rohde / Global Warming Art
Species combined current, historical, and stressed range models based on current climate for Douglas-fir. From Richard Waring, Oregon State University College of Forestry website: http://www.pnwspecieschange.info/linked/df.pdf. Richard Waring, Oregon State University College of Forestry
Ocean Acidification • CO2 causes oceans to become more acidic, reducing calcification rate of marine organisms Healthy coral (B) Degraded coral and water quality. USGS photos
Earth sea-level change history Story similar to temperature. We care most about what’s happening now, and what will happen in the next 100 years and beyond. homepage.ufp.pt
Sea-level fall Sea-level rise
Here come the beaches! (Above) Source: Stan Riggs (Left) Source: Marten Vandenberg Vandenberg (2011)
Jekyll Island Erosion--The topography of Jekyll Island illustrates the process of erosion occurring on most of Georgia's barrier islands. Many of the islands consist of a Pleistocene-era core to which a Holocene-era barrier island became attached around 5,000 years ago. Subsequent erosion by the rising sea has removed most of the Holocene barrier sands. Courtesy of V. J. Henry
The Anthropocene • Term introduced by Nobel Laureate Paul Crutzen • Reasoning: global environmental effects of humans • Geological Society of America supports formalization of term • Exact starting date being debated • See: Crutzen, P. J., 2002, Geology of mankind: Nature, v. 415, p. 23.
The Keeling Curve Named for Charles David Keeling, the first person to document the rise in Carbon Dioxide concentration. It is the longest continuous record of atmospheric carbon dioxide, taken at Mauna Loa Observatory, Hawaii. From The Scripps CO2 Program: http://scrippsco2.ucsd.edu/
CO2– the main greenhouse gas • Humans produce 8 billion tons annually • Volcanoes produce about 300 million tons • Current rate of increase: 2 ppm per year (James Hansen, NASA climatologist)
The Vostok Plot Temperature CO2 Dust ice core Image created by Robert A. Rohde / Global Warming Art.
Water Vapor • Most important greenhouse gas • Accounts for 60% of greenhouse warming • BUT! • Concentrations vary around the globe • 36% - 66% depending on location and time • Long-term constant in atmosphere • Not responsible for current warming
Water vapor, atmospheric temperature, and clouds? • Warm atmosphere holds more water vapor, more water vapor leads to more warming (POSITIVE FEEDBACK) • More water vapor means more clouds which block sunlight which means cooling (NEGATIVE FEEDBACK) • Still, water vapor is variable, but a long-term constant
Global Warming Potential (GWP) • GWP is measure of how much a gas contributes to global warming • A function of: • Efficiency of a molecule as a greenhouse gas • Lifespan of the molecule
Global Warming Potential (GWP) Carbon dioxide has a low GWP but is so plentiful and has such a long lifespan that it is the most important greenhouse gas. Data from Pilkey and Pilkey (2011)
Methane • EPA estimates over 50% of methane comes from human activities
Origin of the “hockey stick” IPCC (2007) Figure 2.2
350.org • James Hansen believes we need to maintain a maximum of 350 ppm atmospheric CO2 to: • “Preserve a planet similar to that on which civilization developed and to which life on Earth is adapted” • Author and environmentalist Bill McKibben founded 350.org, a group dedicated to building a global grassroots movement to solve the climate crisis
Naysayers [Global warming] “…the greatest hoax ever perpetrated on the American people.” Senator James Inhofe (R-Okla)
Inhofe vs realclimate.org • Inhofe: • “We are also in the midst of a natural warming trend that began about 1850, as we emerged from a 400 year cold spell known as the Little Ice Age.” • www.realclimate.org: • Natural factors can’t account for all the warming • Inhofe statement based on Michael Crichton novel State of Fear
Inhofe vs realclimate.org • Inhofe: • “the well-known phenomena of the Medieval Warming [sic] Period–when, by the way, it was warmer than it is today” • www.realclimate.org: • All quantitative paleoclimate reconstructions of the past millennium published in the scientific literature have come to the opposite conclusion
Climategate • November 2009, stolen emails • From East Anglia University Climate Research Unit • Evidence of scientists fudging data • Unwanted papers blocked from publication • Global warming exposed as a scam