Download
1 / 11
110 likes | 246 Vues
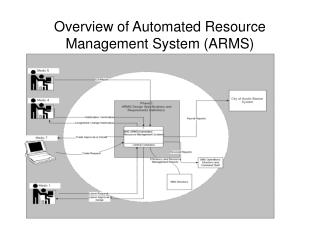
How Agricultural and Resource Management Survey (ARMS) Data Have Been Used by AFPC. Dr. James W. Richardson Co-Director Agricultural and Food Policy Center Regents Professor and TAES Faculty Fellow. Data to Serve 21 st Century Agriculture: Expanding ARMS December 1, 2003.

E N D
How Agricultural and Resource Management Survey (ARMS) Data Have Been Used by AFPC Dr. James W. Richardson Co-Director Agricultural and Food Policy Center Regents Professor and TAES Faculty Fellow Data to Serve 21st Century Agriculture: Expanding ARMS December 1, 2003
AFPC’s Use of ARMS Data Base • AFPC has benefited from the ARMS data base for more than a dozen years • ARMS data base has been used to • Validate representative farms • Obtain information we do not ask our producer panels • Obtain information on structural differences across farms • Obtain information for average farms in new regions
AFPC’s Representative Farms Data Base • AFPC develops data to simulate representative farms through panel interviews • Information obtained are: • Farm size, tenure, and rental arrangements • Crop mix & yield history • Herd size & productivity • Farm program participation history • Production costs by enterprise • Fixed costs, by category for the whole farm • Asset values • Machinery complement and replacement details
Representative Farms and Ranches Dairy Wheat Dairy Wheat Cattle Dairy Cattle Dairy Dairy Dairy Feed Grain Hog Cattle Rice Hog Feed Grain Hog Cattle Feed Grain Wheat Wheat Feed Grain Cotton Cattle Dairy Cattle Wheat Rice Cotton Dairy Feed Grain Hog Cattle Feed Grain Rice Cotton Feed Grain Rice Rice Cotton Rice Dairy Cotton Dairy Cotton Cotton Dairy Cotton Rice Cotton Dairy Feed Grain Dairy Cotton Rice Rice Cattle Cotton Dairy
AFPC’s Representative Farms Data Base • Panel farms located in major production regions • Locations of panel farms specified by economists on House and Senate Ag Committees • Panel farms used to “represent” farms for a region of importance to Congress • Representative farms simulated with FLIPSIM to analyze likely consequences of alternative policies • Costly to develop and maintain farm level data base
Validation of AFPC’s Representative Farms • Questions are always: How representative are the farms? Are the data from a small panel interview accurate? • ARMS data base used to address these questions, and more • ARMS data is sampled to develop a sub-sample of survey farms that matches a representative farm • Range of acres (600 to 1400 if AFPC farm is 1000 acres) or range for the number of cows (or sows) • Crops produced (e.g.., corn and soybeans) • Start with one crop reporting district and then add CRDs to gain adequate sample size
Validation of AFPC’s Representative Farms • After a sub-sample is identified that has the same average acres of cropland or number of head • Calculate averages for 50+ variables used to validate our farms, such as: • Acres of each crop, total costs of production for crops and livestock, fixed costs by category, asset values, milk production, receipts from crops and livestock, government payments • Results are very good, usually within 5% of each other
AFPC and the ARMS Data Base • Information that can be obtained from ARMS that panels do not provide: • Debt levels, off-farm income, family living expenses • Data in ARMS sub-sample used to calculate average debt to asset ratios for long- and intermediate-term assets • Added benefit, the ARMS data matches with Ag Census so • Calculate the portion of farms in a region represented by AFPC farms, e.g., Iowa grain farm represents 26% of farms in the sub-sample region
AFPC and the ARMS Data Base • ARMS used for farm structure research • Debt to asset ratios calculated for different size farms, by: • Type of debt (long- and intermediate-term), • Enterprise (crop or livestock farms), and • Regions that often combine CRDs and cross state lines and in Texas go to sub-state level • Production practice (e.g., irrigation) • Cost of production and off-farm income across farm sizes
AFPC and the ARMS Data Base • Access to ARMS data base makes our jobs easier; we are more confident our farms are “representative” • We still need contacts with actual producers in the different regions for: • Local production risk information • Details on rental arrangements (cash vs. share) • Details on machinery complements and replacement schedules • Technology adoption and changes in production practices • Changes in crop mixes in response to cost and policy changes
AFPC and the ARMS Data Base • Thanks to ERS and NASS for developing ARMS and making it available • Special thanks go to Jim Johnson and Mitch Morehart for their help in using the ARMS data base