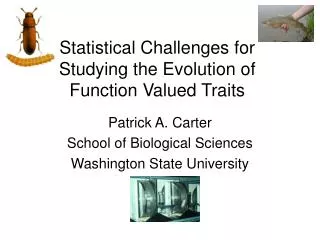
Statistical Challenges in Evolutionary Analysis of Function-Valued Traits
300 likes | 434 Vues
This work addresses critical statistical challenges in studying the evolution of function-valued traits (FVTs). It explores how organisms evolve through processes like selection and genetic drift, investigating the role of genetic variation in shaping evolutionary patterns. We examine how phenotypic functions relate to evolutionary history, emphasizing the need for biologically meaningful curve registration and comparison of mean trajectories across different populations. By focusing on genetic variances and covariances, we aim to evaluate the impact of selection on trait evolution, providing insights into the dynamic interplay between genetics and evolutionary processes.

Statistical Challenges in Evolutionary Analysis of Function-Valued Traits
E N D
Presentation Transcript
Statistical Challenges for Studying the Evolution of Function Valued Traits Patrick A. Carter School of Biological Sciences Washington State University
Interesting Problems in Evolutionary Biology • How do organisms evolve? • What processes are involved (selection, genetic drift); how do they interact? • What is the role of genetic variation in evolution? • How does genetic variation shape evolution? • How does evolution alter genetic variation? • What influences the tempo of evolution? • Constraints • My lab investigates these questions at the both the genetic and physiological levels.
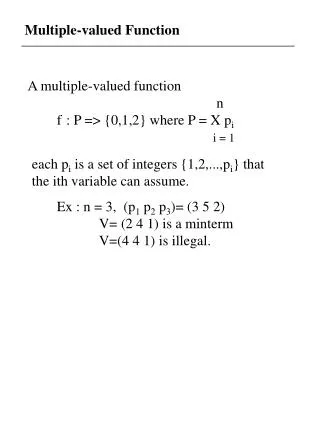
Basic Quantitative Genetics • Most traits show continuous variation and are influenced by many genes. • If family relationships are known, the phenotypic variance can be partitioned: • VP = VG+VE • VG also can be partitioned: • VG = VA + VD + VI • VA is additive genetic variance (variance in breeding values) • One trait: simple variance • Multiple traits: G matrix • FV Trait: G function
Interesting Questions about the Evolution of FV Traits • Have we estimated the phenotypic function in the most meaningful way biologically? • Has the phenotypic function evolved in response to selection, and in the way we predicted? • Has the underlying genetic variance-covariance function evolved in response to selection?
Statistical Challenges • Register the curves in a biologically meaningfully way. • Compare mean trajectories from different populations with different evolutionary histories. • Compare G functions from different populations with different evolutionary histories.
Registration • How do we align curves that contain variation in multiple points of biological interest? • Growth curves of larval insects: • Hatch • High Growth • Peak = hormonal shift • Wandering phase = loss of body mass • Pupation = end of larval phase
Population Comparisons • Evolutionary biologists frequently want to compare characteristics of populations with different evolutionary histories, especially: • Mean population phenotypes (has selection changed the trait?) • Genetic variances and covariances (has selection eroded the variances and covariances as alleles become fixed?)
Statistical Challenges • Formally compare mean phenotypic curves • Most experimental designs are nested, with replicate lines nested within experimental selection group. Replicates lines can provide information about genetic drift. • Formally compare G functions (and their eigenfunctions) from different populations.
Acknowledgements • Students: Ted Morgan, Steph Kane, Greg Ragland, Drew Reinbold, Kristy Bellinger, Kristen Irwin, Anna Heink • Collaborators: Fun Value Group • Funding: NSF (DEB 0083638, DEB 0105079, EF 0328594), National Institute of Mathematical and Biological Synthesis
Statistical Challenges • Formally compare growth curves in selected vs. non-selected populations. • Compare selection responses: along axis of major variation vs. axis in “nearly null space”. • Formally compare G functions from different populations.