Download
1 / 23
230 likes | 324 Vues
Explore various diagnostic tools beyond sector assessments to enhance judicial reform projects. Includes analysis techniques, public opinion surveys, case file examinations, and institutional analysis methods.

E N D
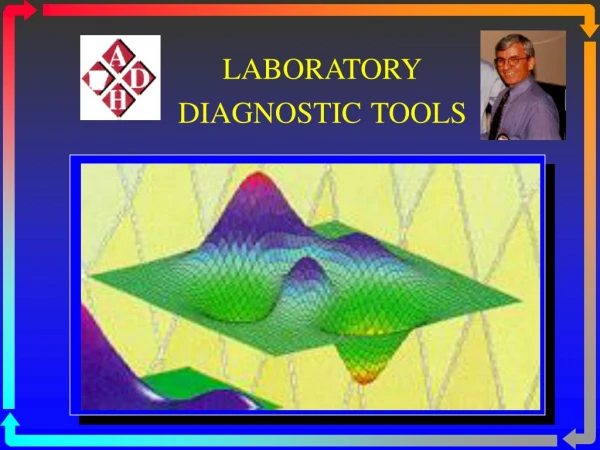
Diagnostic Tools for Judicial Reform Moving Beyond the Sector Assessment January, 2004
Some Personal Biases • We are doing development projects, not just making loans • Projects should aim at resolving societally significant problems with effective remedies • Judicial reform projects could do better here – impacts as opposed to just outputs • Information and analysis are key
Why we need better tools • Sector assessments give overview • Methodology emphasizes “what everyone knows” • Perspectives of the usual suspects • Remedies reflect fads and too often produce Christmas trees • No baseline for measuring progress
Alternatives • Not to replace SA, but to expand on and validate its contents • All have strengths and weaknesses • Applicability depends on resources and problems to be explored • While offer more “precision,” it is important to recognize their limitations
Public Opinion Surveys • Examples: WBI country surveys, cross-country governance indicators, Investment Climate Analyses, cross national polls like Latinobarometro • Strengths: demonstrate perceived problem, can put in comparative perspective, get leaders’ attention • Weaknesses: perceptions, insufficiently specific, may reflect past not present, don’t tell you what to do.
Related tools • “Sherwood” focus on costs of justice • Doing Business • Strengths: same as above, but look more “scientific” • Weaknesses: quality of data, question of what they are measuring, do respondents interpret the questions the same way?
Analysis of Aggregate Statistics • Where any are available, they can test some conventional wisdom (Are workloads excessive? Are budgets too small? Is litigation rate high?) • Also identify some unsuspected trends • Interpretation requires comparative data • Poor quality calls for caution – incomplete, inconsistent categories, bad data entry • Work best in more developed systems or most developed sectors of underdeveloped
Analysis of Raw Data • With more automation, increasingly possible to access data on individual cases • Allows to disaggregate categories, cross variables, give better picture of what is happening to workload. • Same cautions as above – poorly managed systems contain many errors, inconsistent or unintelligible classifications • Still, over time will replace next example – sampling of case files
Case File Analysis • Here, manual style– random sample of physical case files drawn and analyzed • Data extracted on characteristics of interest (e.g. times, parties, amounts, stages) • Strengths – best way of tracking what happens to real cases • Weaknesses: expensive, slow, works best in more organized courtrooms, requires courts’ permission
Case File Analysis: Examples • Can test common beliefs – all plaintiffs are bankers, there is much delay, judicial bias • Can uncover unsuspected trends – most cases are not resolved, delays are in enforcement, attachment is an obstacle. • Can use flow charts to demonstrate alternative trajectories of cases • With a large enough sample can do statistical analysis of sections – crossing variables to identify internal trends
In-depth Institutional Analysis • Methodology like sector assessment, but problem focus (informed by other studies) • Combines inputs from various sources, statistics, interviews, informed observation • Best done by experienced specialist, but also requires multi-disciplinary approach and appreciation for broader impacts. • Probably a second-stage tactic, after initial problem identification
A Note on Judicial Governance • Focus has been on reform projects, for donors and dialogue with counterparts. • However, analysis is important for judicial managers, as part of their standard repertoire. • Their involvement in process, discussion of product can help reorient ideas about management. • Good management requires good information – at least in LAC, this is the forgotten element.
TABLES ILLUSTRATING USE OF DIAGNOSTIC TOOLSAGGREGATE STATISTICS FIGURE I: Comparative Statistics on Judicial Workloads
TABLES ILLUSTRATING USE OF DIAGNOSTIC TOOLSAGGREGATE STATISTICS FIGURE II: Comparative Statistics from Brazil’s National and State Court Systems (excluding juizados especiais
TABLES ILLUSTRATING USE OF DIAGNOSTIC TOOLSAGGREGATE STATISTICS,DISAGGREGATED BY MATERIAL FIGURE III: Brazil, Annual First Instance Filings per Judge (1999-2003)
TABLES ILLUSTRATING USE OF DIAGNOSTIC TOOLSAGGREGATE STATISTICS,DISAGGREGATED BY MATERIAL FIGURE IV: Brazil, Annual First Instance Dispositions per Judge (1999-2003)
TABLES ILLUSTRATING USE OF DIAGNOSTIC TOOLSAGGREGATE STATISTICS,DISAGGREGATED BY MATERIAL FIGURE V: Brazil, First Instance Filings Over Time (Labor Courts 1941—2003; Federal Courts 1967—2003; State Courts 1990—2003)
TABLES ILLUSTRATING USE OF DIAGNOSTIC TOOLSCASE FILE DATA FIGURE VI: Brazil, Ratio of Second Instance Filings to First Instance Dispositions
TABLES ILLUSTRATING USE OF DIAGNOSTIC TOOLSCASE FILE DATA FIGURE VII: Mexico, Juicios ejecutivos MERCANTILES (JEM)
TABLES ILLUSTRATING USE OF DIAGNOSTIC TOOLSCASE FILE DATA FIGURE VIII: Mexico, JEM, Value of Claims
TABLES ILLUSTRATING USE OF DIAGNOSTIC TOOLSCASE FILE DATA FIGURE IX: Mexico, JEM, Duration from initiation to closure
TABLES ILLUSTRATING USE OF DIAGNOSTIC TOOLSCASE FILE DATA FIGURE X Mexico, Juicios Ejecutivos: Characteristics associated with an increase in the time to judgment
FIGURE X Mexico, Juicios Ejecutivos: Characteristics associated with an increase in the time to judgment