U.S. -- 1Q 2014
U.S. -- 1Q 2014. The following report presents Dow Jones VentureSource’s quarterly findings for U.S. venture capital fundraising , investment, valuation, and liquidity. The included charts and graphs offer a comprehensive view of the trends currently affecting the venture capital market.


U.S. -- 1Q 2014
E N D
Presentation Transcript
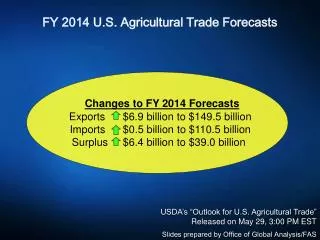
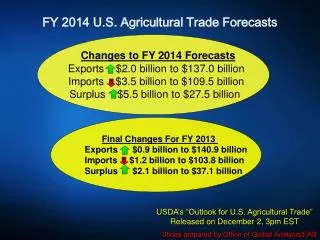
The following report presents Dow Jones VentureSource’s quarterly findings for U.S. venture capital fundraising, investment, valuation, and liquidity. The included charts and graphs offer a comprehensive view of the trends currently affecting the venture capital market. • Highlights for 1Q 2014 include: • U.S. venture capital fundraising doubles in amount raised, but number of funds remains level; • Venture capital investment was at its highest since 1Q 2001; • Median pre-money valuation increased 59% from 4Q 2014; • Venture-backed mergers and acquisitions (M&As) reach highest quarterly figure since 3Q 2000. Initial public offerings (IPOs), however, took a dip.
Venture Fundraising in U.S. Rises Significantly from 4Q 2013 73 funds garnered $9.6 billion in 1Q 2014, more than doubling the amount raised in the previous quarter, while number of funds remained stable. Technology Crossover Ventures VIII LP was the largest U.S. venture capital fund of 1Q 2014 raising $2.2 billion and accounting for 23% of the total amount raised during the quarter. Median U.S. fund size was $175 million. FUNDRAISING U.S. VC Fundraising (2011 – 2014) Based on multiple closings
Largest VC Funds Raised in 1Q 2014 FUNDRAISING
U.S. Venture Investment on the Rise in 1Q 2014 U.S.-based companies raised $10.7 billion from 862 venture capital dealsin 1Q 2014, a 18% increase in capital and a 10% decline in number of deals from the previous quarter. In contrast with 1Q’13, amount invested registered a 44% increase, while number of deals dipped 3%. Information Technology (IT) and Business and Financial Services are the strongest sectors, respectively with 32% and 25% share of total amount invested. FINANCING Equity Financings into U.S. – based, VC-backed Companies (2011 – 2014)
FINANCING Equity Financings into U.S.–based, VC–backed Companies, by Round Class (2011 – 2014) Number of Deals
FINANCING Equity Financings into U.S.–based, VC–backed Companies, by Round Class (2011 – 2014) Amount Raised ($B)
FINANCING Equity Financings into U.S.-based, VC-backed Companies, Median Deal Size ($M) (2011 – 2014) Median Equity Deal Size ($M)
Equity Financings into U.S.-based, VC-backed Companies, by Industry Group (1Q 2014) • IT saw the largest investment allocation, with 246 deals garnering $3.4 billion and accounting for 32% of total equity investment. • The Business and Financial Services sector raised the second highest proportion of investment for 1Q’14: 210 deals accumulated $2.6 billion, up 15% in amount raised, but down 7% from respective 4Q’13 figures. • Healthcare placed third with $2.3 billion in 171 deals, a 1% drop from the previous quarter. The sector’s investment figure represents a 21% share of total equity investment into U.S. VC-backed companies for the quarter. • $1.8 billion were raised by Consumer Services in 158 deals, a decrease of 15% in deal flow, while capital invested went up by 10%. FINANCING 1Q’14 Industry Breakdown By Amount Raised ($B) 1Q'14 Industry Breakdown By Number of Deals
FINANCING Most Active Investors for U.S.-based, VC-backed Companies (1Q 2014)
Number of Deals by Primary Region 1Q 2014 2 166 17 47 38 80 321 28 35 47 73 Amount Raised ($B) by Primary Region 1Q 2014 $0.004 $1.28 $0.12 $0.24 $0.31 $1.26 $5.68 $0.16 $0.32 $0.29 $0.67 FINANCING Alaska/ Islands Mid-Atlantic Midwest Central Midwest East Mountain New England Northern California Pacific Northwest South Central South East Southern California Number of Deals in 1Q 2014 by Primary Region Amount Raised ($B) in 1Q 2014 by Primary Region
Number of Deals by subregion 1Q 2014 Amount Raised ($B) by subregion 1Q 2014 FINANCING Subregion Breakout Amount Raised ($B) Subregion Breakout Number of Deals
VALUATIONS Equity Financings into U.S. – based, VC-backed Companies, Median Pre-money Valuation ($M) (2011 – 2014)
Venture M&A and IPO Market Activity in the U.S. during 1Q 2014 Mergers and acquisitions (M&As) of venture-backed companies decreased by 2% from 4Q 2013, with 119 deals garnering $17 billion. 38 venture-backed IPOs took place during 1Q 2014, the highest figure in a quarter since 3Q 2000 when 75 were completed. LIQUIDITY Exit Opportunities for U.S. VC-backed Companies (2011 – 2014)
U.S. VC-backed M&As (2011-2014) 119 M&As of venture-backed companies in U.S. garnered $17 billion during 1Q 2014, the highest quarterly figure since 3Q 2000, when $23 billion were raised. In contrast with 4Q 2013, when a total of 122 transactions accumulated $12 billion, though the number of M&As fell by 2%, the amount raised rose by 37%. The largest M&A of the quarter was Nest Labs Inc., which was acquired by Google Inc. (Nasdaq: GOOG) for $3.2 billion. LIQUIDITY U.S. VC-backed M&A Activity (2011 - 2014)
Top 3 U.S. M&As (1Q 2014) LIQUIDITY
U.S. VC-backed IPOs (2011-2014) 38 venture-backed companies raised $2.9 billion through public offerings in 1Q 2014. Number of deals increased by 90%, while capital raised registered a 17% decrease from the previous quarter. The largest IPO of the quarter was Castlight Health Inc. (NYSE: CSLT), which completed a $178 million IPO. LIQUIDITY U.S. VC-backed IPO Activity (2011 - 2014)
Top 3 U.S. IPOs (1Q 2014) LIQUIDITY
Dow Jones VentureSource helps venture capitalists, corporate development executives, investment bankers and service providers find deal and partnership opportunities, perform comprehensive due diligence and examine trends in venture capital investment, fund-raising and liquidity. It provides accurate, comprehensive data on venture-backed companies – including their investors and executives – in every region, industry and stage of development throughout the world. The investment figures included in this release are based on aggregate findings of Dow Jones' proprietary research and are contained in VentureSource. This data was collected through surveys of professional firms, interviews with company executives, and from secondary sources. These venture capital statistics cover equity investments into early stage, innovative companies and do not include companies receiving funding solely from corporate, individual, and/or government investors. Figures contained throughout the report current at time of editorial but are subject to change without notice. No statement herein is to be construed as a recommendation to buy or sell securities or to provide investment advice. About Dow Jones Dow Jones & Companyis a global provider of news and business information, delivering content to consumers and organizations via newspapers, Web sites, apps, video, newsletters, magazines, proprietary databases, conferences, and radio. Dow Jones has produced unrivalled quality content for over 120 years and today has one of the world’s largest news-gathering operations with nearly 2,000 journalists in more than 80 bureaus, including The Wall Street Journal, America’s largest newspaper by paid circulation. Other premier brands include Barron’s, MarketWatch, DJX and Factiva. Dow Jones publishes in 13 languages and distributes content in 28 languages, combining technology with news and data to support business decision making. The company pioneered the first successful paid online news site and its industry leading innovation enables it to serve customers wherever they may be, via the Web, mobile devices, Internet-connected televisions, and tablets. MEDIA CONTACT: Erin Carpenter-Maier 212.416.4874 Erin.Maier@dowjones.com ABOUT US