Alternative Performance Metrics for Server RFPs
Alternative Performance Metrics for Server RFPs. Joe Temple Low Country North Shore Consulting jtemple29588@lc-ns.com www.lc-ns.com. Local Factors / Constraints. Cost Models. Non-Functional Requirements. System z. System x. Strategic Direction. Workload Fit. Power. Technology

Alternative Performance Metrics for Server RFPs
E N D
Presentation Transcript
Alternative Performance Metrics for Server RFPs Joe Temple Low Country North Shore Consulting jtemple29588@lc-ns.com www.lc-ns.com
Local Factors / Constraints Cost Models Non-Functional Requirements System z System x Strategic Direction Workload Fit Power Technology Adoption Reference Architectures This is an IBM Chart that bridges from platform selection into Performance Architecture
Fit for Purpose Workload Types Mixed Workload – Type 1 Parallel Data Structures – Type 3 • Scales up • Updates to shared data and work queues • Complex virtualization • Business Intelligence with heavy data sharing and ad hoc queries • Scales well on clusters • XML parsing • Buisness intelligence with Structured Queries • HPC applications Application Function Data Structure Usage Pattern SLA Integration Scale Highly Threaded – Type 2 Small Discrete – Type 4 • Scales well on large SMP • Web application servers • Single instance of an ERP system • Some partitioned databases • Limited scaling needs • HTTP servers • File and print • FTP servers • Small end user apps Black are design factors Blue are local factors This is the IBM preSales Architects ‘ view of workload types
Fitness Parameters in Machine Design Can customized to machines of interest. Need to know the specific comparisons desired These parameters were chosen to represent the ability to handle, parallel, serial and bulk data traffic. This is based on Greg Pfister’s work on workload characterization in In Search of CLusters
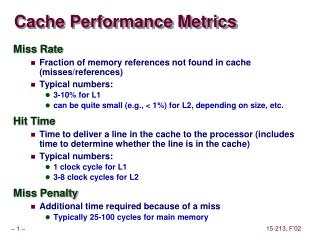
Definitions TP - Thread Speed X Threads Thread Speed ~ Adjusted Clock Rate ITR - Internal Throughput Rate Peak rate as measured in benchmarks ITR <= TP ETR – External Throughput Rate Average rate as delivered in production ETR ~ ITR X Average Utilization
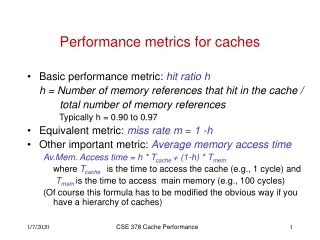
Throughput, Saturation, Capacity TP Measured ITR Capacity TP Pure Parallel CPU ITR Other resources and Serialization ETR Load and Response Time
Very, Very Few Clients experience ITR Most enterprises are interested in ETR ~ Average Utilization X ITR Most users experience response time
Throughput Throughput: TP (Assume parallel load with no thread interactions) Saturation: Internal Throughput Rate (ITR) ITR TP when highly parallel throughput is not limited by “other” resources (I/O, Memory, Bandwidth, Software, Cache) Capacity: External Throughput Rate (ETR) Utilization limited to meet response time.
Effect ofusing single dimension metrics.(Max Machines) Common Metrics: ITR TP ETR ITR Power advantaged z is not price competitive Consolidation: ETR << ITR unless loads are consolidated Consolidation accumulates working sets Power and z advantaged Cache can also mitigate “Saturation” The “standard metrics” do not leverage cache. This leads to the pure ITR view of relative capacity on the right.
Consolidation Average 61%, Peak 78% Peak to Average = 1.28 Average 21%, Peak 79% Peak to Average = 3.76 Typical x86 Consolidation 8X work on 4X CPUs 2X Enterprise Server Consolidation 64X work on 18X CPUs 3.6 X Dedicated x86 Server 1 X work on 1X CPUs 1 X Average 39%, Peak 76% Peak to Average = 1.95
The Math Behind Consolidation Roger’s Equation: Uavg = 1/(1+HR(avg)) Where HR(avg) = kcN1/2 For Distribution of work: N = s (the number of servers per load) For Consolidation of work: N =1/ n (the number of loads per server) k is a design parameter (Service Level) c is the variability of the initial load
Response Time and Variability Acceptable Response Time Hi Variability Moderate Variability Low Variability “No Variability”
The math behind the Hockey Stick Use your favorite queuing model. If you use M/M/1 or M/M/K models cSQRT(N) will be assumed to be 1. We used an estimator for M/G/1 or G/G/1 T = To(1+ c2N(u/(1-u)) Notice that elements of Rogers’ equation appear In both cases N affects the variability impact We also know that HR(u) = (1-u)/u T = To(1+ c2N/HR(u))
We have a model which uses these concepts. It generates characteristic curves And profiles machines
Bottom Line on workload fit • “Best” is user dependent • Some dependence on “workload factors” • Mostly dependent on parallelism, size, usage pattern and service level of loads • Small, variable loads will lean toward density • Larger, more steady loads will lean toward throughput • Need to decide figure(s) of merit • Designers should set at least 2 requirements: • Throughput and Thread Capacity • ETR and Density • Density and Response Time • Etc.
Comparing Max Machines One core per socket of Power7 is dedicated to VIO and Intel pathlength is penalized for I/O
What is the figure of merit? • ITR – What we benchmark? • ETR – closer to business value ($/Day)? • Average Response Time – User experience? • Response time at Peak – speed at max load? • Stack Density – VMs/Core (Loads per core)? • Average Utilization – Efficiency of use? None of the machines is “best across the board” Designers should specify at least 2 metrics
Stacked single thread workloads Z has highest density and highest speed Power has highest throughput (SMT4) Each workload small and variable.
Bigger, more Parallel Loads Power still has highest throughput z has less speed advantage z maintains density advantage Moderate Variability, Larger workloads
Very Large Parallel Loads Power is clear winner except for density Low Variability, Larger workloads
Low Country North Shore Consulting Visit lc-ns.com or eMail Joe at jtemple29588@lc-ns.com
lc-ns work research and services • Collateral Development and tech writing • Further development of workload fit model • Application of workload fit model to specific comparisons (will not compete with IBM). • Specification and application of benchmarks to model • Understanding tails of short interval utilization distributions • Validation of sizings • Machine positioning • Workload analysis (usage patterns, response time parallelism and load consolidation/distribution.) • Skill transfer/ Education / Speaking on the above • Analysis/Development of Intellectual Property • Leadership Mentoring / Coaching