Download
1 / 45
450 likes | 683 Vues
Cambridge Center for Behavioral Studies. Behavioral Economics and the Future of Behavior Analysis. November 8, 2003 Steven R. Hursh, Ph.D. Johns Hopkins University School of Medicine and Science Applications International Corporation Hurshs@saic.com 410-538-2901.

E N D
Cambridge Center for Behavioral Studies Behavioral Economics and the Future of Behavior Analysis November 8, 2003 Steven R. Hursh, Ph.D. Johns Hopkins University School of Medicine and Science Applications International Corporation Hurshs@saic.com 410-538-2901
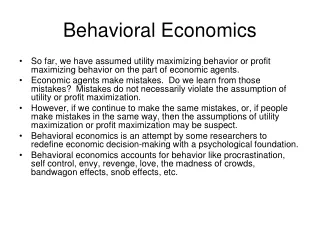
Behavior Analysis and Economics • “an adequate science of behavior should supply a satisfactory account of the individual behavior which is responsible for the data of economics in general” (B.F. Skinner, Science and Human Behavior, 1953). • Questions: • Are the principles of economic behavior consistent with the basic principles of reinforced behavior? • What can we learn by trying to answer that question?
Pmax -1.0 Omax Total Responding Inelastic Elastic Unit Price (Resp/Reinf) Unit Price The Demand Curve and Response Output Function
Closed Economy Open Economy Elasticity of DemandTemporal Substitution Baseline: 12 hr session for food under increasing FR schedules. Values increased daily across 21 days. 1 Hr-FR 1: 12 hr session for food under increasing FR schedules was followed by 1 hr of food available under an FR 1. The open – closed distinction helped to explain the first disparity between economic and behavioral principles.
Elasticity with Different Reinforcers Elasticity is more than “strength” of reinforcement.
Defining Price • Price: the constraint on obtaining the reinforcer expressed as a cost-benefit ratio: • Responses per reinforcer (ratio schedule) • Dollars per package of goods • Minutes of responding per reinforcer (interval schedule) • Unit Price: • Responses per unit of consumption • Normalized Price: • Responses per percent of total daily consumption
Unit Price Total Volume of Drug, not Reinforcers per Day Equal Unit Prices: FR 8: 2 Deliveries = FR32: 8 Deliveries = FR64:16 Deliveries 4 The unit price concept helped reconcile a second distinction between economic and behavior principles.
Convergence to a single demand curve across a range of doses.
Some Key Findings • Drugs of abuse may be ordered in abuse liability by Pmax and Omax. • Elasticity of demand for a drug appears to be related to the speed of onset to effect. • Elasticity of demand appears to be independent of potency and the duration of action.
Why Focus on Consumption? • Discovery of the open versus closed distinction that was directly related to differences in the control of consumption. • Discovery that the defense of consumption varied with reinforcer types in a rational way. • Discovery that unit price unified disparate data in terms of maintenance of overall consumption. • Discovery that local rates of responding varied throughout the day while overall level of responding was consistently related to maintaining a level of consumption.
The notion of complements and substitutes expanded our theory of choice to encompass consumer behavior.
MilestonesEvolution of a Framework • Initial proposals: 1972 • Baboon drug abuse research at Walter Reed Army Institute of Research: 1972-1978 • Open and Closed economies, Substitutes and Complements: 1978 • Behavioral Economic Concepts: 1980, 1984 • Quantitative Analysis of Demand: 1987, 1989 • Unit Price Concept: 1988 • Behavioral Economics of Drug Abuse and Public Policy: 1991, 1993, 2000 • Normalized Demand Analysis: 1995 • Behavioral Economic Analysis of Drug Self-administration with U. Michigan Medical School: 1994-Present
The Challenge of the Future • Expert Panel review of DOD research on soldier performance (October 2003, SR Hursh, chair): • “The soldier of the future will be embedded in a highly sophisticated system, networked with other systems and soldiers, dispersed, and empowered for independent yet coordinated action.” • “….All soldiers - not only leaders - must have the ability to make rapid decisions, while under stress normally not realized by present day personnel.” • These requirements are as true of civilians in a high technology workplace as they are for the future combat soldier.
Panel Critique of Cognitive Assessment • “Problem: Virtually all assessment tools currently used for cognitive performance research are designed to assess specific, discrete, and often very simple cognitive tasks, not integrative cognitive functioning. Most simulators currently used to test militarily relevant performance assess relatively simple psychomotor actions. This is a problem common to nearly all cognitive research, not just DoD sponsored cognitive research, yet it creates a fundamental barrier to delivering meaningful products [that sustain effective performance].” • “….need for a core capability todesign and validate measures of higher cognitive processes, including decision-making, judgment, initiative and cooperative team performance.”
Reinforcement Basic Biological Processes Individual Behavior Demand Curve Supply Curve Social Behavior Public Policy Formulation Primary and Conditioned Reinforcement Schedules Demand Curves Behavioral Economics Mediated Reinforcement Role of “Artifacts” of Culture: Money
Consumer Demand Supplier Production Equilibrium Price Dollars for Goods Goods for Dollars
Consumer Expenditure Curve and Supplier Demand Curve for Money Pmax Total Expenditures (Dollars) Total Revenues (Demand for Money) Equilibrium Price Dollars for Goods Goods for Dollars Our current understanding of consumer demand can be directly extended as a basis for understanding the behavior of the supplier.
Functional Analysis of both the Demand and Supply Sides • The process of reaching, maintaining, and readjusting the equilibrium point requires more than a knowledge of the intersection of the supply and demand curves. • The following two charts illustrate that knowing the entire supply curve is necessary to predict the adjustment to and maintenance of equilibrium. • To put it another way, a functional analysis of the verbal community which mediates the constraints on reinforcement (the “supply function”) may reveal reliable processes that are characteristic of the interaction between “consumer” and “supplier” behavior - the essence of behavior in a social context.
Supplier Production Consumer Demand Dollars for Goods Goods for Dollars Mediated reinforcement is more than the sum of the parts: Convergence to a stable price depends on the shape of the supply curve Equilibrium Price
Supplier Production Consumer Demand Dollars for Goods Goods for Dollars Equilibrium Price The supply curve is like a feedback function that changes characteristics based on the social/economic context of the supplier
Stimulus Control Reinforcement Primary and Conditioned Reinforcement Schedules Demand Curves Individual Behavior Behavioral Economics Mediated Reinforcement Demand and Supply Social Behavior Discrimination Generalization Attention Mediated Stimulus Control Distributed Discrimination Verbal Behavior
Cognitive Function and Verbal Behavior • Language and verbal behavior are essential elements of what is commonly called “cognitive function”. • The inter-relation of the speaker/listener with the verbal community defines the behavior as social or organizational. • Interestingly, Skinner, in Verbal Behavior, stipulated that a “functional analysis of the verbal community is not part of this book..” (1957). • Nearly 50 years later, this is still an agenda item: Behavior analysis must attempt to solve the difficult problem of understanding individual verbal behavior as part of a functional analysis of the verbal community. • The control of verbal behavior in a social context is a mediated and distributed process in the same way that reinforcement in an economic context is a mediated process (“Distributed Cognition”, Hutchins).
Broader View of Verbal Behavior • Our current behavioral language may be inadequate. • Avoid the “it’s just this” response to “cognitive” analysis. • Mediated Stimulus Control • Functional analysis of the interactions with others for the what, when & where of behavior – the verbal community. • Distributed Discrimination: Important concepts that control and direct one’s behavior are acquired within and by a group and held in common. • Domains of analysis include: • “Distributed Cognition”, Integrative Cognitive Function • Instructional control & cultural transmission of knowledge • Networks and work groups • Information technology and systems • Human factors research • Crew Resource Management (CRM)
Broader View of Verbal Behavior • Mediated Reinforcement • Functional analysis of negotiation with others for the why of behavior – individual and shared reinforcers - “rewards and goals” - reinforcing verbal community • Behavioral Economics (Distributed Reinforcement) • Domains of analysis include: • Cooperation and competition • Contracts • Counseling and Behavior therapy • Organizational “motivation” • Game Theory • Public Policy • Dual Function: often the same socially mediated events have both discriminative and reinforcing functions.
Why is it Important? • The efficiency of work groups depends on an understanding of how information transactions occur and the variables that modulate those transactions. • Minimizing the effects of stressors, such as fatigue, emotional stress, and conflict require an understanding of these processes. • The increasing role of technology and the design of technological systems will depend on our understanding of these processes. • Designing effective public policy depends on our understanding of mediated stimulus control and reinforcement in the public arena.
NASA Priority: Psychosocial Factors in Long Duration Spaceflight • Three person crews will travel in confined craft for two year round-trip to Mars. • Maintenance of psychosocial cooperation is one of four major challenges to success ( along with radiation, bone density loss, & medical emergencies) • IBR-SAIC collaboration to study the problem funded by NASA through the NSBRI. (P.I. Joseph Brady.) • The basic scenario is a test bed for the study of Mediated Stimulus Control and Distributed Discrimination under stressful conditions.
Distributed Interactive Simulation • Three person interactive simulation. • Complete monitoring of all verbal behavior: text, audio, visual, and drawing. • Embedded complex discrimination task – concept formation problems. • Cooperative activity required for successful team performance. • Repeated acquisition procedure that permits repeated experimentation with experienced crews. • Trained crews achieve a stable rate of acquisition of embedded concepts and accumulation of available points. • Ability to manipulated time pressure stress, competing activities, incentive conditions, and social context.
8’ 8’ 8’ 8’ MISSION CONTROL SPACE WORK STATION #1-Orbiter SPACE WORK STATION #2-Lander SPACE WORK STATION #3-Rover 12’ 16’ 4’ IBR PSYCHOSOCIAL TEAM WORK AREADistributed Interactive Simulation • Three Work Stations plus Mission Control (Sound Attenuated) • Computer networked with internet access • 500 sq. ft. Published with Joe Brady and Bob Hienz; supported by NASA through the NSBRI
GENERAL SCENARIO • Three person Mars exploration team - separated by duty station • Crew Positions:Location: • ControllerLander • Sample CollectorRover • Data AnalystOrbiting Module - Computer/Commo • Primary Mission: Collect samples of specified type in specified area and time. Maximize “hits” in allotted time. • Secondary Mission 1(Stressor): required interruptions for “radiation protection drills” causes intermittent “stress” of time pressure on primary mission. • Secondary Mission 2 (Distractor): potential discovery of Mars sample containing signs of life competes with primary mission.
ORBITAL MODULE ANALYSIS SAMPLE AREA 1 “Canyon” ROVER SAMPLER LANDING STATION CONTROL SAMPLE AREA 3 “Ravine” SAMPLE AREA 2 “Plain” DIAGRAM OF PROBLEM
Repeated Acquisition of Concepts Sample Dimensions Shape: Size: Color:
Repeated Acquisition of Concepts • Sample Concepts: • Many worthless samples, plus • Each region, five sample types (concepts) that vary in average value. • Each mission covers three regions, fifteen total sample concepts. • Crew cooperation to acquire concepts: • collect samples and transmit data to Orbiter (Rover), • analyze them for value and transmit results back (Orbiter), and • determine the characteristics of valuable samples (All). • Crew cooperation to collect valuable samples: • Set sensors to find them (Orbiter), • Mark them on the screen for collection (Lander), • Maneuver to collect them (Rover), • Discarding worthless samples (Rover, Lander), and • Transferring valuable ones to the Lander for storage (Rover, Lander). • Experienced crews can collect 90% of the valuable samples.
Crew Performance with Loss of Audio and Scribbles Group Performance Totals Individual Crewmember Performance
Cumulative Records of Individual and Crew Performance Individual Crewmember Performance Group Performance Totals With Audio and Scribbles Without Audio and Scribbles
Experienced Crew Performance with Massive Communication Failure Mission 41 Individual Crewmember Performance Group Performance Totals
Team Performance Variables • Communication Modes • Time Pressure Stress • Positive and Negative Incentives • Shared and Individual Incentives • Cooperative and Competitive Scenarios • Social Familiarity – Host and Intruder • Competing Goals – Crew versus Mission Control • Personality and Crew Roles • Quantitative and Qualitative content of messages
Summary Stimulus Control Reinforcement Primary and Conditioned Reinforcement Schedules Demand Curves Individual Behavior Behavioral Economics Mediated Reinforcement Demand and Supply Social Behavior Discrimination Generalization Attention Mediated Stimulus Control Distributed Discrimination Integrative Cognitive Function Verbal Behavior Supporting Role of “Artifacts” of Culture and Technology