
Verification of Wind Atlases for Wind Energy Optimization
Explore the accuracy of various wind atlases for wind energy applications through detailed verification with certified mast measurements. Discover which atlases perform best in reproducing wind speed and direction, aiding in wind potential estimation and energy loss calculations. The study evaluates reanalysis data like MERRA and ERA-Interim against downscaled data sets using MM5 and WRF, highlighting disparities in their accuracies. The research showcases the importance of selecting the most suitable wind atlas for specific applications in wind energy projects.

Verification of Wind Atlases for Wind Energy Optimization
E N D
Presentation Transcript
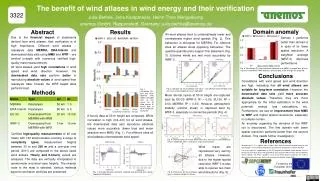
The benefit of wind atlases in wind energy and their verification Julia Bethke, Jens Kampmeyer, Heinz-Theo Mengelkamp anemos GmbH, Reppenstedt, Germany; julia.bethke@anemos.de 3322 Domain anomaly Abstract Results All wind atlases tend to underestimate lower and overestimate higher wind speeds (Fig. 2). This behaviour is strongest for MERRA. For offshore sites all atlases show opposing behaviour. The quantile-quantile plots support this statement (Fig. 3). Extreme winds are met most accurately by WRF-3. Due to the financial impact of statements derived from wind atlases, their verification is of high importance. Different wind atlases – reanalysis data MERRA, ERA-Interim and downscaled data sets using MM5 and WRF – are verified in-depth with numerous certified high-quality mast measurements. All wind atlases yield high correlations in wind speed and wind direction. However, the downscaled data sets perform better in reproducing absolute values of wind speed than reanalysis data. Overall, the WRF based atlas performs best. Domain 1 performs better than domain 2 in spite of its lower spatial resolution. A weighted average (WRF-3) improves performance. Fig. 6: Correlation (R²), bias and mean absolute error (MAE) averaged over all met masts for the different WRF domains. 6-hourly data at 50 m height are analysed. Conclusions Correlations with wind speed and wind direction are high, indicating that all wind atlases are suitable for long-term correlation. However, the downscaled data sets yield more accurate absolute values. Therefore, they are more appropriate for the initial estimation of the wind potential, energy loss calculations, etc. Furthermore, we see an improvement from MM5 to WRF and higher spatial resolutions, especially in complex terrain. An anomaly regarding the domains of the WRF run is discovered. The first domain with lower spatial resolution performs better than the second domain. This needs further investigation. Fig. 3: QQ-plots for two exemplary met masts - one offshore mast (left plot) and one mast in low complexity terrain (right plot). Fig. 1: Correlation (R²), bias and mean absolute error (MAE) averaged over all met masts for all wind atlases. 6-hourly data at 50 m height are analysed. Methods Mean diurnal cycles at 50 m height are captured best by EU-20 (WRF-3: R² = 0.50, EU-20: R² = 0.54, MERRA: R² = 0.33). However, atmospheric stability (vertical shear) is captured best by WRF-3, especially in convective periods (Fig. 4). 6-hourly data at 50 m height are compared. While correlation is high (0.6–0.9) for all wind atlases, the downscaled data sets reproduce absolute values more accurately (lower bias and mean absolute error MAE) (Fig. 1). For offshore sites all wind atlases underestimate wind speed. Certified high-quality measurements of 45 met masts with 160 anemometers covering a range of complexity types, measurement heights between 30 m and 200 m and a one-year time period (2011) are compared to the above listed wind atlases. Hourly and 6-hourly values are analysed. The data are vertically interpolated to anemometer and wind vane heights. The nearest node to the mast is selected. Various methods beyond correlation and bias are presented. References Fig. 4: Diurnal cycles of vertical wind shear for a met mast in low complexity terrain. September 2011 is chosen as a convective period.. Mengelkamp, H.-T., H. Kapitza und U. Pflüger, 1997: Statistical-dynamical downscaling of wind climatologies, Journal of Wind Engineering and Industrial Aerodynamics, 67&68, 449-457 Part of this work was supported by the EU FP7 project SOPCAWIND (Grant 296164). Parts of the measurement data were kindly provided by the Fraunhofer IWES and the German Weather Service (DWD). The FINO 1 platform is part of the FINO project, funded by the Federal Ministry for the Environment, Nature Conservation and Nuclear Safety (BMU). Wind roses are reproduced very well by all atlases. However, due to the higher spatial resolution WRF-3 is also able to resolve two main wind directions (Fig. 5). Funded by the European Union Fig. 5: Wind roses for one exemplary mast in medium complexity terrain. Fig. 2: Average deviations between modeled and observed wind speed frequency distributions.


