Download
1 / 48
480 likes | 598 Vues
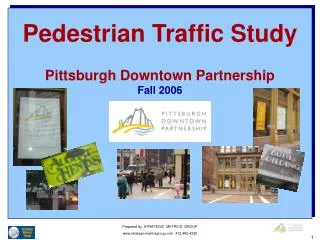
Pedestrian Traffic Study Pittsburgh Downtown Partnership Fall 2006. Prepared by: STRATEGIC METRICS GROUP www.strategicmetricsgroup.com 412.480.4332. SUMMARY OF KEY FINDINGS.

E N D
Pedestrian Traffic StudyPittsburgh Downtown PartnershipFall 2006 Prepared by: STRATEGIC METRICS GROUP www.strategicmetricsgroup.com 412.480.4332
SUMMARY OF KEY FINDINGS • Traffic volume varies greatly across the 8 locations. The daily average traffic count is 4,557 pedestrians; with the highest count on Smithfield and the lowest at Market Square (Clock). • Saturday traffic (1,847) is significantly less than weekday (5,755). • Those working downtown comprise the majority (59%) of the pedestrian base. • Pedestrians spend an average of $47 a week downtown: - Retail $19 - Food $24 - Services $4 • Downtown residents are a small, but important group. While small in number (just 3% of pedestrian base), residents spend substantially more downtown than all other pedestrian groups.
SUMMARY OF KEY FINDINGS • Downtown spending habits differ by location, creating “hot” (10th & Penn) and “cool” spots (Smithfield) of pedestrian purchasing potential. • Market Square is viewed unfavorably by most pedestrians. Two major barriers, safety concerns & cleanliness, have to be recognized and resolved first, for Market Square to flourish and grow into a vibrant downtown destination. • 60% of pedestrians are aware of PDP. Most identify PDP with either cleaning, improving, developing, or promoting downtown. Asked for their overall impression of PDP, pedestrian remarks are largely positive: • 70% Positive • 21% Neutral • 9% Negative
Methodology and Sampling • Pedestrian Traffic Data • Pedestrian Survey Findings • Location & Pedestrian Profiles • Key Findings & Summary
Pedestrian Traffic Counts Pedestrian Surveying Pedestrians and wheelchairs Not Counted: Bicyclists, Skateboarders, Children too small to walk Pedestrians had to cross over the reference point where counter was stationed. Each pass of a pedestrian was counted. Someone crossed by a counter twice was counted twice. Both sides of street counted – except 5th Avenue (Buhl) due to construction. Interviewers chose pedestrians at random walking within half a block of the location. Response Rate: 5% - This means 20 people had to be approached to gain 1 completed survey (19 of 20 said “No”). Time to Complete: Average of 3 minutes Incentive: No incentive offered Most interviewing was conducted on the move, walking aside of busy pedestrians. WHO WAS COUNTED AND SURVEYED
EIGHT TARGET LOCATIONSSTUDIED IN TWO PHASES Surveying and counting were both conducted throughout entire 12 hour day (7:00 AM to 7:00 PM).
8 Locations 8 Reference Points 1. 5th Avenue between Wood and Market Buhl Building 2. Smithfield between Forbes and 5th Sbarro’s 3. 10th and Penn August Henry’s 4. 10th and Liberty Liang Hunan 5. 7th Avenue between Will. Penn Place & Grant Gulf Tower 6. Strawberry Way between Smithfield & Will. Penn Place Weiner World 7. Center of Market Square corner of Forbes & Market Clock 8. PPG egress into Market Square (Primate's & Natl. City Bank) PPG Bench/Post COUNTER’S REFERENCE POINT AT EACH LOCATION In most cases the reference points are located in the middle of a block. Both sides of the street were counted except for 5th Ave. (Buhl), due to construction.
Methodology and Sampling • Pedestrian Traffic Data • Pedestrian Survey Findings • Location & Pedestrian Profiles • Key Findings & Summary
TOTAL PEDESTRIAN TRAFFIC COUNT8 Locations n =109,356 # of Pedestrians Time of Day A total of 109,356 pedestrians were counted over the entire project. Peak volume times include 8 AM, 5 PM, and the lunch or mid-day hour.
TOTAL COUNT BY LOCATION3 Day Pedestrian Totals Overall Location Average 13,670 # of Pedestrians 3 day totals vary dramatically by specific location. Smithfield at Sbarro & Macy’s sees the bulk of the traffic counted across the 8 locations.
PERCENT OF TOTAL TRAFFIC 3 DAY TOTALS BY LOCATION All 8 locations counted for 3 days each. Smithfield at Sbarro and Macy’s sees one-quarter of all observed traffic. Market Square varies greatly by location. PPG (egress) sees 3 times more traffic than the PPG clock. n = 109,356
AVERAGE DAILY COUNT BY LOCATIONMean Number of Pedestrians Overall Daily Location Average 4,557 # of Pedestrians Each location average is based on a 3 day average – 2 weekdays and a Saturday.
AVERAGE DAILY COUNT 2006 and 2001Mean Number of Pedestrians Per Day 2001 study only counted weekday traffic. In ’01 and ’06 these 4 locations were counted In late September.. # of Pedestrians Heavy ‘06 construction Smithfield shows a drop in traffic, while Penn and Liberty have risen. 5th Avenue is problematic for comparison purposes due to the major construction and closing of the sidewalk in 2006.
AVERAGE COUNT BY DAY OF WEEKMean Number of Pedestrians Overall Daily Location Average 4,557 Weekday = 5,755 Weekend = 1,847 # of Pedestrians Wednesday and Friday were the heaviest days for pedestrian traffic. Note that Wednesday was sunny, and the warmest of all days in this study.
LOCATION SUMMARY Smithfield is the busiest location of the 8 studied. MS PPG, 10th & Liberty, and 5th Ave. are highly traveled with similar pedestrian volume. Note: Each location sampled for 3 days. Average Count = Total divided by 3.
SUMMARY OF PEDESTRIAN COUNTSDAY by LOCATION RAW COUNTS Weekday traffic drives the volume in downtown. The Smithfield location sees the heaviest pedestrian traffic. Traffic at the two Market Square locations is very different. The low “clock” traffic (center of square) is indicative of people not walking through Market Square. Pedestrians walk the perimeter or stay in one area. n = 109,356
COUNT OF ALL TRAFFIC n = 109,356 Note: NC = “not counted”. Phase 1 counted on Wed., Phase 2 on Thur..
PERCENT OF ALL TRAFFIC n = 109,356 Note: NC = “not counted”. Phase 1 counted on Wed., Phase 2 on Thur..
PEDESTRIAN TRAFFIC COUNT SUMMARY • 8 downtown locations are each studied across a 3 day period. • The study period includes 2 weekdays and a Saturday. • Counting is conducted from 7:00 AM to 7:00 PM. • 109,356 pedestrians are counted in the study. • An average of 4,557 pedestrians cross a given location in the 12 hour period. Average daily counts by location range from a high of 9,300 (Smithfield) to a low of 1,500 at the Market Square Clock.
PEDESTRIAN TRAFFIC COUNT SUMMARY • Of the 4 days studied, Friday is the heaviest day of the week (9,000 daily per location). • Saturday is by far the slowest day for pedestrians (less than 2,000 daily per location). • As expected, the daily traffic volume is dispersed symmetrically with an early AM rush hour peak, a large lunch hour spike, and an early evening peak at the PM rush hour.
PRESENTATION OVERVIEW • Methodology and Sampling • Pedestrian Traffic Data • Pedestrian Survey Findings • Location & Pedestrian Profiles • Key Findings & Summary
PURPOSE OF PEDESTRIAN VISIT Q1. Which one of the following best describes your primary reason for being in downtown today? Those working downtown varies by location. n = 808 Nearly 6 in 10 randomly sampled pedestrians are in downtown for work.
TYPE OF PEDESTRIAN SUMMARY 100% 100% 100% 100% 100% 100% 100% 100% 100%
FREQUENCY OF PEDESTRIAN VISIT Q2. Which best describes how often you walk past this location? n = 802 One in three pedestrians pass the location multiple times per day.
VISIT PURPOSE SUMMARY • The largest block of pedestrians surveyed (59%) are downtown because they work downtown. Special Visitors (11%) and Students (10%) comprise the second largest block of downtown pedestrians. • Business visitors (9%), Shoppers (8%), and Residents (3%) comprise the third, and smallest group of pedestrians. • 7th Avenue (Gulf) and Strawberry Way (Weiner World) see more work force pedestrians than the other 6 locations. Market Square Clock and Market Square PPG (National City) see the lowest percentage of downtown work force pedestrians.
VISIT FREQUENCY SUMMARY • Half of those surveyed walk by the location once a day or more. One-third pass by the location multiple times per day. • The number of repeated passes pedestrians make past a location is linked to the purpose of the downtown visit. • Downtown workers and residents make more frequent and repeated passes by locations than all other groups. • Shoppers and Special Visitors (Dining, Theatre, Sporting Event) make the lowest number of passes by a location.
DOLLARS SPENT - DOWNTOWN RETAILAmount Spent in a Typical Week Q5a. In a typical week, how many dollars do you spend with downtown retailers (such as Macy’s, etc.)? Overall Average = $18.55 Of those who spend at least $1 = $39.85 Do NOT Spend n = 812 Half of all pedestrians do not commonly patronize downtown retailers. 25% spend over $20 with retailers in a typical week.
DOLLARS SPENT ON - FOOD/BEVERAGEAmount Spent in a Typical Week Q5b. In a typical week, how many dollars do you spend on food and beverage downtown? Average = $24.44 Of those who spend at least $1 = $31.40 Do NOT Spend n = 812 8 of 10 pedestrians commonly patronize downtown establishments for food and drink. 37% spend over $20 on these items in a typical week.
DOLLARS SPENT ON SERVICESAmount Spent in a Typical Week Q5c. In a typical week, how many dollars do you spend on downtown services (dry cleaning, salons, etc.)? Average = $3.67 Of those who spend at least $1 = $20.00 Do NOT Spend n = 812 2 in 10 pedestrians regularly utilize and pay for downtown services.
SPENDING SUMMARY BY LOCATIONAverage Spent in a Typical Week $47 Average Spent Per Category Per Week Retail = $19 Food = $24 Services = $4 $62. $54. $51. $49. $45. $43. $34. $34. Average Total Spent Per Week $47 n = 812 Surveyed pedestrians spend an average of $47 downtown in a typical week. Cultural District respondents report higher spending habits.
SPENDING BY TYPE OF PEDESTRIANAverage Spent in a Typical Week Average Spent Per Category Per Week Retail = $19 Food = $24 Services = $4 $114 $60 $46 $46 $36 $35 Average Total Spent Per Week $47 n = 808 Residents spend significantly more in downtown than the other groups.
PEDESTRIAN ECONOMICS Weekly Scenario Pedestrians at The 8 locations spend an estimated total of $1.6M weekly. Respondents at Penn & Liberty spend more, and drive up the total dollar expenditure at these locations. Pedestrians pass- ing through / into Market Square report strong weekly spending. This is good news for new potential retail & vendors who arrive via redevelopment. Using the average pedestrian count of each location, and average per person weekly expenditures, a weekly total dollar volume can be estimated.
TRAFFIC VOLUME versus DOLLAR VOLUMEWeekly Scenario Cool Spot $$ Hot Spot $$ $$ Hot Spot $$ n = 812 The variation in personal spending across the 8 locations creates traffic-dollar volume differentials. Smithfield under-spends its traffic, while Penn and Liberty over-spend their respective traffic.
SUMMARY OF PEDESTRIAN ECONOMICS • On a weekly basis, most pedestrians (78%) spend money downtown on food & beverages. Half spend money with retailers, and one-fifth spend on personal services. • Weekly expenditures with downtown businesses differ markedly by type of pedestrian (purpose), and by the location pedestrians frequent. • Average Weekly Retail Expenditure = $19 • Average Weekly Food/Bev Expenditure = $24 • Average Weekly Services Expenditure = $4
SUMMARY OF PEDESTRIAN ECONOMICS • Pedestrians surveyed on Penn and Liberty (near 10th) report the highest expenditures. Those at Strawberry Way and Smithfield report spending the least. • On a weekly basis, Residents report spending more per person in downtown than any other group. At $114, Residents spend twice as much, or more, than most others surveyed. • Based upon reported spending habits, the addition of 1 downtown Resident is more valuable to downtown businesses than any 1 other type of pedestrian.
SUMMARY OF PEDESTRIAN ECONOMICS • An integrated analysis of traffic volume and dollar volume reveals both “hot” and “cool” spots in downtown. • Hot Spots are places where % of total dollars spent exceeds % of total traffic volume. • 10th & Penn and 10th & Liberty • Cool Spots are places where % of total dollars spent is less than % of total traffic volume. • Smithfield (Sbarro / Macy’s) and Strawberry Way
SUMMARY OF PDP IDENTITY & PERCEPTIONS The associations linked to PDP by pedestrians are very positive and, for the most part, factually correct. Slightly over half (52%) identify PDP with “Cleaning” or “Developing – Improving - Promoting Downtown”. 70% hold a favorable, positive impression of PDP. 21% report neutral comments, while the balance of 9% holds a less than favorable impressions. Most of the neutral comments are actually skewed positively towards PDP; “they need more budget/money” and “they are trying but it is a struggle to do this work”.
. PERCEPTIONS of MARKET SQUARE
MARKET SQUARE IDENTITY Q7. When I say “Market Square”, what is the first thing that comes to mind? “HARSH FACTS ARE FRIENDLY” 4 of the 5 top responses are very negative. These issues are basic problems that must be solved NOW, as a first step to any Market Square redevelopment plan or initiative. Mentions < 1% account for 5% of all responses but are not shown on this chart.
IMPROVING MARKET SQUARE Q8. What would help make Market Square a more interesting and appealing place for you to visit? Core Improvements Half of the suggested improvements refer directly to safety, cleanliness, and the drug/criminal element. Other Improvements More events, shops, restaurants, grocery / markets. Mentions < 1% account for 3% of all responses but are not shown on this chart.
MARKET SQUARE SUMMARY • 2 core problems are currently hurting Market Square’s image and potential to be a thriving, vibrant downtown destination : • SAFETY and CLEANLINESS • The first step of any redevelopment plan must include the recognition and resolution of these very basic, yet very important concerns. • Some respondents do identify and describe Market Square in more positively: “HISTORIC”, “SOCIAL GATHERING”, “ALWAYS SOMETHING GOING ON”. • The improvements cited by respondents reinforce the safety and cleanliness issues. In addition, more shops, restaurants, and markets will make Market Square more appealing.
SMG OBSERVATIONSOF MARKET SQUARE • SMG interviewers and traffic counters spent a total of 36 hours in Market Square over the course of 3 days. The Director of Operations and the President both spent time over the course of the 3 days in Market Square as well. • SMG believes their unique, 12 hour-a-day, “on the ground” perspective is noteworthy: • SMG interviewers and counters were threatened and told to leave by people “hanging around” Market Square • Very small police presence • Aggressive pan-handling • Alcohol and drug use • Avoidance of certain areas of the square • At dusk (6:30-6:45 PM) the above problems intensify • In sum, SMG’s field team, staff, and senior team were surprised with the conditions of the area, and the lack of law enforcement.
PRESENTATION OVERVIEW • Methodology and Sampling • Pedestrian Traffic Data • Pedestrian Survey Findings • Location & Pedestrian Profiles • Key Findings & Summary
DEMOGRAPHICS – ALL RESPONDENTS AGE GROUP INCOME GENDER PARTY SIZE 8 in 10 respondents are 54 or younger. 6 in 10 make less than $50K. Slightly more males. Almost 8 in 10 respondents are walking alone (solo).
CHARACTERISTICS OF 8 LOCATIONS As expected, age and income levels appear to be related. The 2 youngest, lowest Income groups spend $34 + $45 = $79 per week downtown. The 2 oldest groups spend a total of $111. The highest traffic locations, Smithfield and MS PPG, are also the 2 youngest locations. The 2 Market Square locations skew to a younger age with an average/above average weekly spending pattern.
PRESENTATION OVERVIEW • Methodology and Sampling • Pedestrian Traffic Data • Pedestrian Survey Findings • Location & Pedestrian Profiles • Key Findings & Summary
SUMMARY OF KEY FINDINGS • Traffic volume varies greatly across the 8 locations. The daily average traffic count is 4,557 pedestrians; with the highest count on Smithfield and the lowest at Market Square (Clock). • Saturday traffic (1,847) is significantly less than weekday (5,755). • Those working downtown comprise the majority (59%) of the pedestrian base. • Pedestrians spend an average of $47 a week downtown: - Retail $19 - Food $24 - Services $4 • Downtown residents are a small, but important group. While small in number (just 3% of pedestrian base), residents spend substantially more downtown than all other pedestrian groups.
SUMMARY OF KEY FINDINGS • Downtown spending habits differ by location, creating “hot” (10th & Penn) and “cool” spots (Smithfield) of pedestrian purchasing potential. • Market Square is viewed unfavorably by most pedestrians. Two major barriers, safety concerns & cleanliness, have to be recognized and resolved first, for Market Square to flourish and grow into a vibrant downtown destination. • 60% of pedestrians are aware of PDP. Most identify PDP with either cleaning, improving, developing, or promoting downtown. Asked for their overall impression of PDP, pedestrian remarks are largely positive: • 70% Positive • 21% Neutral • 9% Negative