Graph Analysis and Interpretation Techniques in Biology Studies
Chapter 2 emphasizes the importance of reading the book and analyzing graphs in biology studies. The LENSES acronym is used to analyze graphs effectively, requiring students to copy or draw assigned graphs and interpret them using Labels, Equate, Notice, Speculate, Explain, and Summary methods.

Graph Analysis and Interpretation Techniques in Biology Studies
E N D
Presentation Transcript
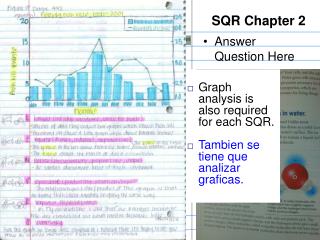
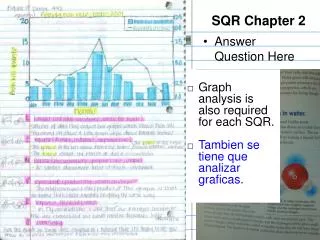
Answer Question Here Write the section headings as ?s In left column SQR Chapter 2 • Students need to read the book • Tienen que leer el libro • Graph analysis is also required for each SQR. • Tambien se tiene que analizar graficas. Read
LENSES LENSES is an acronym used to analyze graphs. On the top half of the page you copy the assigned graph. For each letter look at the graph and describe it.
Copy, or draw the graph in the top half of the page. • Copia, o haga la grafica en la parte ariba. L Labels (Ind/Dep variables, Units for each) E Equate (Direct, Indirect, exponential) N Notice (observations, properties, slope) S Speculate (Predicting relationships) E Explain observations S Summary - biology
L labeled? What are the independent and dependent variables? What are the units? E Which type of graph would you equate Look at the X and Y-axis what are they it to: Direct (where X changes Y), Indirect (Y not tied to X, like bars), or Exponential (where Y the graph looks like a J-curve) N Looking at the curve, or bars. What do you notice happening? S What do you speculate, think, predict why it is happening? E Based on everything you’ve seen explain your prediction. S Summarize the Biology concept learned.