Download
1 / 32
320 likes | 486 Vues
Selling Cable in a Meter-Diary Market. The Problems with the Nielsen TV Diary. Note To Our Members:. Discussing Ratings in a Meter-Diary Market.

E N D
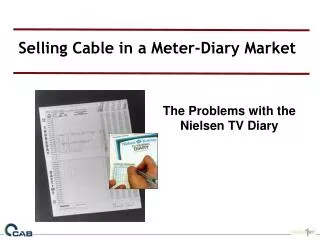
Selling Cable in a Meter-Diary Market The Problems with the Nielsen TV Diary
Note To Our Members: Discussing Ratings in a Meter-Diary Market This presentation was developed to help you talk about the research shortfalls when relying on the Nielsen diary methodology for demographic audience estimates in any meter-diary market. Local proof points should be inserted wherever possible.
TV Audience Measurement in Markets With Diaries • What’s The Problem with Diaries? • Barometer of Real Performance • Another View for the Future • Industry Approved Local Cable • Posting Guidelines
Diaries Under-Report Demographic Ratings 2005 2006 2007 2008 2009 2010 2011 SET-METER / DIARY MARKETS Pre-2006 Diaries Under-Report Demo Ratings by 10-25% Programming Choice Outgrew a Paper Diary’s Ability to Capture Complete TV Viewing Years Ago
“Zero Cell” Was a Contributing Factor 2005 2006 2007 2008 2009 2010 2011 SET-METER / DIARY MARKETS Pre-2006 Diaries Under-Report Demo Ratings by 10-25% “Zero Cells” Appeared on Average in 60% of Lower-Rated Programs Programming Choice Outgrew a Paper Diary’s Ability to Capture Complete TV Viewing Years Ago
Diary Homes Set Meter Homes Used for HH Audience Used for Demographics What is a Zero Cell? Two Types of Homes in Markets 14 - 60 Meter/Diary Integration Demographic Audience Estimates
Set Meter Homes Reports Television Tuned to ESPN Example of Zero Cell Rating Phenomenon Feb 29, 8:15 - 8:30 pm, ESPN Diary Homes No Diaries Report Viewing to ESPN Used For Demographics Meter/Diary Integration “Zero” Diary + Meter Tuning = Zero Cell
45% - 75% of Quarter-Hours Reporting Zero Viewing Due to Diary Zero Cell Example Market Set Meter Viewing (HH) with No Diary Record (Persons) Yields Missing Viewers – ‘Zero Viewer Cells’ Zero cell ascription model is being used for both broadcast and cable stations. The majority of demo rtg. changes by individual network between 0.1 to 0.9 range; most 0.1 or 0.2 increase. Some zero cells remain; this is statistically appropriate. Source: Nielsen Media Research.
Nielsen “Models” Out Some of the Zero Cell Problem 2005 2006 2007 2008 2009 2010 2011 SET-METER / DIARY MARKETS July 2006 Nielsen Implements Zero Cell Ascription Model So We’ve Solved Zero Cell? Used to Reduce Effect of Missing Diary Numbers by “Modeling” Data from Similar Quarter Hours
Zero Cell Ascription Model Lessens Incidence of Missing Diary Data - - Beginning July 2006 Local Market Name Market Set Meter Viewing (HH) with No Diary Record (Persons) Yields Missing Viewers – ‘Zero Viewer Cells’ Zero cell ascription model is being used for both broadcast and cable stations. The majority of demo rtg. changes by individual network between 0.1 to 0.9 range; most 0.1 or 0.2 increase. Some zero cells remain; this is statistically appropriate. Source: Nielsen Media Research. Data is for demonstration purposes only; Cannot be used for sales purposes.
+51% Broadcast Cable -27% Before & After Impact in Local Market NameDMA Total Day (M-Su 6a-12m) Persons 25-54 Total Reportable Cable 47.8% Source: Nielsen Media Research, Albuquerque-Santa Fe DMA, Persons 25-54 Aggregate Share%, May’06 vs. Jul’06, M-Su 6a-12m. Reportable cable shares includes viewing via cable television or satellite dish program delivery. “The number of cable homes receiving advertisements on any network is an estimate and may vary by geographic areas and other factors. Any statement of the number of cable homes receiving an advertisement as well as cable audience estimates are based on a Nielsen Interconnect Universe Estimate and adjusted on a pro rated basis by internal subscriber counts by zone [See also Nielsen ViP report]. Total number of cable homes include viewing to cable networks via technologies we do not represent for sales purposes. Package good for 10 days based on availability. Rates based on package only. Any deviation from package may result in renegotiation. The information provided will be periodically updated by the Company. For more information please contact your Advertising Sales Executive.”
+71% Broadcast Cable -29% Before & After Impact in Local Market NameDMA Prime Time (M-Su 7p-10p) Persons 25-54 Total Reportable Cable 47.4% Source: Nielsen Media Research, Albuquerque-Santa Fe DMA, Persons 25-54 Aggregate Share%, May’06 vs. Jul’06, M-Su 6a-12m. Reportable cable shares includes viewing via cable television or satellite dish program delivery. “The number of cable homes receiving advertisements on any network is an estimate and may vary by geographic areas and other factors. Any statement of the number of cable homes receiving an advertisement as well as cable audience estimates are based on a Nielsen Interconnect Universe Estimate and adjusted on a pro rated basis by internal subscriber counts by zone [See also Nielsen ViP report]. Total number of cable homes include viewing to cable networks via technologies we do not represent for sales purposes. Package good for 10 days based on availability. Rates based on package only. Any deviation from package may result in renegotiation. The information provided will be periodically updated by the Company. For more information please contact your Advertising Sales Executive.”
Before & After Impact in Local Market NameDMA Source: Nielsen Media Research, Albuquerque-Santa Fe DMA, Persons 25-54 Aggregate Share%, May’06 vs. Jul’06, M-Su 6a-12m. Reportable cable shares includes viewing via cable television or satellite dish program delivery. “The number of cable homes receiving advertisements on any network is an estimate and may vary by geographic areas and other factors. Any statement of the number of cable homes receiving an advertisement as well as cable audience estimates are based on a Nielsen Interconnect Universe Estimate and adjusted on a pro rated basis by internal subscriber counts by zone [See also Nielsen ViP report]. Total number of cable homes include viewing to cable networks via technologies we do not represent for sales purposes. Package good for 10 days based on availability. Rates based on package only. Any deviation from package may result in renegotiation. The information provided will be periodically updated by the Company. For more information please contact your Advertising Sales Executive.”
Nielsen “Models” Out Some of the Zero Cell Problem 2005 2006 2007 2008 2009 2010 2011 SET-METER / DIARY MARKETS July 2006 Nielsen Implements Zero Cell Ascription Model - Corrects About 30% of Previous Zero Cells - Does not Fix Zero Cell Phenomenon - Does not Fix Diary Under-Reporting of Lower Rated Programs Used to Reduce Effect of Missing Diary Numbers by “Modeling” Data from Similar Quarter Hours
July 2006 Zero Cell Ascription Model Reduces Some Zero Cells Does Not Fix Diary Under Reporting So Where Do We Stand Today? 2005 2006 2007 2008 2009 2010 2011 SET-METER / DIARY MARKETS Pre-2006 Actually The Numbers You’re Using Today Are Still Under-Reporting Cable Compared To … Diaries Under Report Demos Zeroes in 40-60% of Cells
Today’s Gold Standard in Television Measurement 2005 2006 2007 2008 2009 2010 2011 SET-METER / DIARY MARKETS 2007 Local People Meter Nielsen Announces Local People Meter in Top 60 Markets LPM True Representation of Persons Viewing (+10-40% on Demo Rating)
What Happens When a Market Gets Local People Meters? The Game Changes…
% Difference in A25-54 Ratings Between Diary & LPM Cable Broadcast +62% +61% -11% -11% -12% SAN FRANCISCO WASHINGTON, D.C. Source: Nielsen Media Research – San Francisco and Washington, D.C. DMA’s. San Francisco: difference between Nov ’03 TVS (Meter-Diary) data and Nov ’04 LPM data. Washington, D.C.: difference between Jul ’04 TVS (Meter-Diary) data and Jul ’05 LPM data. Based on aggregate A25-54 ratings, M-Su 6a-6a. Local People Meters Uncover Real Viewing Missing in Diaries Every Time Nielsen Flips the Switch and Replaces the Diary System with LPM– Broadcast Declines and Cable Increases.
Local People Meters Uncover Real Viewing Missing in Diaries Every Time Nielsen Flips the Switch and Replaces the Diary System with LPM– Broadcast Declines and Cable Increases. % Difference in A25-54 Ratings Between Diary & LPM Cable Broadcast +45% +45% -11% -11% CHICAGO PHILADELPHIA Source: Nielsen Media Research – Chicago and Philadelphia DMA’s. Chicago: difference between Nov ’03 TVS (Meter-Diary) data and Nov ’04 LPM data. Philadelphia: difference between Jul ’04 TVS (Meter-Diary) data and Jul ’05 LPM data. Based on aggregate A25-54 ratings, M-Su 6a-6a.
Local People Meters Uncover Real Viewing Missing in Diaries Every Time Nielsen Flips the Switch and Replaces the Diary System with LPM– Broadcast Declines and Cable Increases. % Difference in A25-54 Ratings Between Diary & LPM Cable Broadcast +38% +33% -9% -21% NEW YORK LOS ANGELES Source: Nielsen Media Research – New York and Los Angeles DMA’s. Difference between Nov ’03 TVS (Meter-Diary) data and Nov ’04 LPM data. Based on aggregate A25-54 ratings, M-Su 6a-6a.
LPM Increases Total Audience Across Most Demos Differences in People Watching Television Percent Difference – Current Sweep LPM Sample Compared to Set Meter/Diary Sample Source: Nielsen Media Research,
Today’s Gold Standard in Television Measurement 2005 2006 2007 2008 2009 2010 2011 SET-METER / DIARY MARKETS 2007 Local People Meter • Nielsen has been using People Meters in its National Sample since 1986 • In 2002 Boston became the first DMA to launch Local People Meter (LPM) service • Now 13 Markets are using Local People Meters • Eight more DMAs are scheduled to launch LPM service in 2008
Today’s Gold Standard in Television Measurement 2005 2006 2007 2008 2009 2010 2011 DIARY-ONLY MARKETS 2002-07 Local People Meter Rollout LPM Proves The Numbers You’re Using Today Under-Report Cable Compared To Broadcast
2007 Local People Meter LPM: Today’s Gold Standard in Television Measurement 2005 2006 2007 2008 2009 2010 2011 DIARY-ONLY MARKETS LPM Proves The Numbers You’re Using Today Under-Report Cable Compared To Broadcast LPM Proves The Numbers You’re Using Today Under-Report Cable Compared To Broadcast Nielsen Announces Local People Meter in Top 60 Markets LPM True Representation of Persons Viewing (+10-40% on Demo Rating)
Local People Meters in Top 60 Markets by 2012? 2004 2005 2006 2007 2008 2009 2010 2011 LOCAL PEOPLE METER ROLL-OUT Boston Philadelphia Dallas Houston Phoenix Orlando Kansas City Oklahoma City New York Wash. D.C. Detroit Tampa Minneapolis Sacramento Columbus Grnsboro-H-W St. Louis Cincinnati Memphis Los Angeles Atlanta Seattle Cleveland Pittsburgh Chicago Miami Milwaukee Louisville San Fran. Denver Salt Lake City Jacksonville Portland OR Baltimore Grnville-S-A-A Buffalo Charlotte (2010) San Antonio Austin Indianapolis West Palm Bch Providence San Diego Birmingham New Orleans Raleigh Durham Norfolk Knoxville Hartford Las Vegas Richmond Nashville Albuquerque Tulsa Dayton LPM Mkt. Live Moved to 2010 Ft. Myers Roll-out TBD
What LPMs Mean for Future Measurement • More Reliable Sample • The LPM sample is always larger than the previous set meter sample • LPM sample is also more representative of the local population • No More Diaries • LPMs collect both household and demographic data electronically, replacing a system that used paper diaries for demographic estimates • Nielsen has estimated that diaries can underreport cable viewing by as much as 60%, depending on the network and daypart • Every Month’s a Sweep Month • Single-source collection means demographic audience estimates are no longer limited to the traditional sweep periods when broadcasters run their best programming • Demo overnights also available • More People Watching More Channels • On average LPM ratings for all persons watching TV in the DMA are higher than the meter/diary estimate • Generally, non-prime dayparts and lower-rated networks enjoy the largest gains Source: Nielsen Media Research
The Future - Electronic Measurement in all Markets - Nielsen’s A2M2 measurement plan calls for electronic measurement in all markets by 2012 - Set Top Box Data - Set top box data is the only viable method to measure the fragmented audiences we have today. - Various issues need to be addressed before STB data can be used as a currency measure but is offering keen insight into viewing patterns today.
More… Local Cable Posting Framework The Cabletelevision Advertising Bureau (CAB) and National Cable Communications (NCC) created the first industry-wide standard framework for posting local cable television. The new posting standards will provide advertising agencies and advertisers, across all markets and all MSOs guidelines for posting local cable. This new document was developed in partnership with the American Association of Advertising Agencies (AAAA) Local Television Committee and has received their approval for use. The new guidelines offer both a recommended standard practice and an acceptable alternative for posting in each of the three local market types (Nielsen Local People Meter (LPM) Markets, Meter/Diary Markets and Diary Only Markets). The new framework also provides a recommended standard practice for posting by period (daypart rotation, fixed position/recurring and fixed position/specials & one-time-only (OTO) events). Additionally, a guideline for posting dependent upon schedule rating points is also available. The CAB and NCC, working with all MSO members, drafted the new guidelines in an effort to insure greater accountability and common practices at the local level. This new framework offers local cable advertisers a standard approach across all markets eliminating the often raised questions about the proper way to post local cable.
More… Local Cable Posting Framework Principles • Posting requirements must be agreed upon prior to the start of the flight. • Goal of stability, reliability, and sound business practice is paramount. • Aim to reduce statistical error through aggregating ratings, expanding demographic targets, and lengthening posting periods. Guidelines • Local Cable posting procedures apply to Interconnect buys only. • Guarantees are to be based on the aggregated performance of the entire flight/schedule – not on individual Network performance • The standard threshold of 90% should continue to be the minimum acceptable delivery. Directional broader threshold should be considered depending on TRP level, demo, scale of buy, market rank, etc. (Standard error ranges for ad-supported Cable viewing sources are regularly greater than +/-10%).
More… Local Cable Posting Framework Guidelines (cont.) • Use wired-Cable-only impressions (i.e. non-ADS) from a C-DMA, FUSION, or NDM survey to project impressions delivered within the Interconnect; they may be Equivalized to the full DMA population. • Audience estimates should be based on electronic measurement which deliver the highest statistical reliability and should be the standard for all Local Cable posts. • No guarantees should be expected using any Diary-based data.
Local Cable Posting Framework * C-DMA or non-ADS impressions; ** NDM – National Data Modeling – Using all national data * All averages should be based on Nielsen average quarter hour methodology.