Download
1 / 20
200 likes | 392 Vues
Class Project Report Sustainable Air Quality, EECE 449/549, Spring 2008 Washington University, St. Louis, MO The Carbon Footprint of Danforth Campus and its Causality Drivers. Instructors: Professor Rudolf B. Husar, Erin M. Robinson In collaboration with WUSTL Sustainability Office. Students:

E N D
Class Project ReportSustainable Air Quality, EECE 449/549, Spring 2008Washington University, St. Louis, MOThe Carbon Footprint of Danforth Campusand its Causality Drivers Instructors: Professor Rudolf B. Husar, Erin M. Robinson In collaboration with WUSTL Sustainability Office Students: Devki Desai Martin Groenewegen Tyler Nading Kate Nelson Matt Sculnick Alyssa Smith Varun Yadav See also a 5 min screencast and more details on the class wiki
Energy Use: Buildings and Transportation On Campus Energy Use Heating The impact on carbon arises from on-campus energy use and from transportation Cooling Appliances Transportation Commuting Air Travel Students University Fleet Faculty/Staff
On Campus Fuels Footprint Electricity Footprint
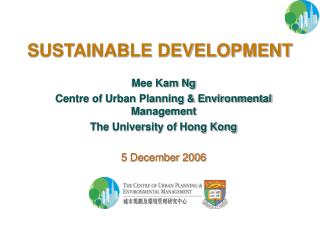
Sustainable Development Development with Due Care of the Environment • Systems approach: linking human activities and their consequences in closed loop • Each component depends on its causal upstream driver – and external forcing • The causal loop can be used as an organizing principle for sustainability analysis Systems (Causality) Loop
Building Area Projected • Student, Faculty Staff Population • Per Student Space • Teaching, research needs • Comfort? Projected Building Area/Student • Actual and Forecast Building Area New since 1990 Student Pop x Area/Student Building Area
Energy Demand Projected • Actual and Forecast Building Area • Building Energy Efficiency • Building Design • Appliances • Usage Pattern Projected Energy Use/Area • Actual and Forecast Energy Demand Area x Energy Use/Area Energy Use
Carbon Footprint Projected • Actual and Forecast Energy Demand • Carbon Emissions Factor • Fuel Mix • Energy Waste • Sequestration Projected Emission/Energy Use • Actual and Forecast Carbon Footprint Energy Use x Emission/Energy Use Emission
Population - Energy/Goods Consumption– Materials Flow - Emissions EconMeasure(EM) Goods &Energy,(GE) i Fuels&Mater.(FM), j Emission (EM), k Metals Industr. Goods Ind. Chemicals CO2 Coal Industrial Prod. Industr. Energy Coal NOx Coal Coal Pop., P Transportation Transp. Energy HC Oil Oil Oil ResComercial ResCom.Engy Oil PM Gas Gas Electric Energy SOx Gas Gas ai Consump./Person bij Fuels/Energy cjk Emission/Fuel-
Science Models – Do they Match? Causality Model Social Work Model
Carbon Footprint: Multi-Science Approach Social-Behavioral Science Physical-Eng. Sciences Sciences Biological, Social
On the Carbon Systems Model • Model is a tool, not an answer • A map for the activities and connections • A map for placing stakeholders • A container of disciplinary models
Possible Activities? • WU Carbon Footprint (Actual, Observations) • Transportation Carbon • (Electric) Energy Usage • Real-time monitoring • Carbon (Causality) Systems Model • Multi-science approach • Tool for testing ideas on Campus Carbon
Sustainable Development – Causality LoopEconomic Development with Due Care of the Environment • Systems approach: linking human activities and their consequences in closed loop • Each component depends on its causal upstream driver – and external environment • The causal loop can be used as an organizing principle for sustainability analysis
1960- Aerosol Science (Coagulation, Bimodal Distribution) • 1970- Atmospheric Science (Transport, Chemistry, Removal Processes) • 1980- Atmosphere Biosphere Interactions (NAS Report) • 1990- Earth Transformed by Human Action (Cambridge) • 2000- Sustainability Exploration • 1998- Industrial Metabolism (UN University) • 1998-WUSTL Class - Sustainable Air Quality/Informatics • 2010- Sustainability Multiple Perspectives, Minds • Disciplinary, Synthesizing, Creating, Respectful, Ethical • Concrete???
Systems Biologya paradigm, usually defined in antithesis to the so-called reductionist paradigm, although fully consistent with the scientific method. The distinction between the two paradigms is referred to in these quotations: • Systems biology is a biology-based inter-disciplinary study field that focuses on the systematic study of complex interactions in biological systems, thus using a new perspective (integration instead of reduction) to study them. .. to discover new emergent properties that may arise from the systemic view in order to understand the entirety of processes that happen in a biological system.
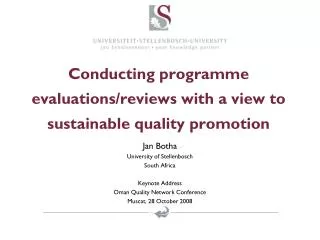
2007-2008 Population Distribution Faculty/Staff Students Distance within 150 miles to WashU considered for analysis.