Inspiring Excellence in LTC Root Cause Analysis
640 likes | 1.11k Vues
Inspiring Excellence in LTC Root Cause Analysis. Presented by Craig Erickson and Beth Irtz, Wind Crest. Quality Improvement Is….

Inspiring Excellence in LTC Root Cause Analysis
E N D
Presentation Transcript
Inspiring Excellence in LTCRoot Cause Analysis Presented byCraig Erickson and Beth Irtz, Wind Crest
Quality Improvement Is… • The integrated, comprehensive, organization-wide methodology used to continuously examine, refine, and revise organizational processes to meet and exceed customers’ expectations • The integration of fundamental management approaches, improvement efforts, tools, and training • An environment that is supportive of excellence, non-threatening in nature, open to suggestions, and conducive to positive change
Quality Improvement Is… • The philosophy that employees want to do their best • Focused on improving systems and processes • Based on measurement, data, and facts • Dependent on teamwork and participation by all • Supported by the facility’s culture, practices, and shared values
Comparison of QA & QI QA QI
Shift to Quality Improvement • Often times facilities can deliver excellent resident care • At times may fail to provide excellent services or resident outcomes • Trying harder will not work • Changing systems of care will work • Need new ideas, tools and systems
Model for Quality Improvement Assess Performance Evaluate for Improvement Identify Problem Quality Involve Employees Planning & Prioritization of Processes Education & Training
Quality Improvement Improved Quality Comes From Improvement in Work Processes
RESULTS SYSTEMS INFRASTRUCTURE FOUNDATION Achieving Quality ‘The House of Quality’
Types of Systems • System of Work: How work is done • System of Management: How the system of work is managed Must improve both to be truly effective
Clinical staff works together Smooth running front line units Information readily available, flows in an easy & timely manner High quality, efficient care Clinical staff works against each other Health care units in tangles Poor flow of communication, information fragmented Harmful, wasteful and expensive Analyze Systems
Improved Quality Comes from Improved Work Processes • A process is a combination of steps that produce a final result • Example- pain assessment + administration of analgesics = pain relief • Only by analyzing & correcting problems with the processes (e.g. no pain assessment) will the desired results be achieved
Goals of Process Improvement • Identify problem areas • Identify sources of variation • Simplify • Eliminate duplication, unnecessary work • Eliminate rework, extra steps • Remove waits, delays • Decrease potential for errors/mistakes • Eliminate waste/reduce expenses
Change vs. Improvement • Change does not equal improvement • Change makes something different • Improvement makes something better • “95 % of changes have nothing to do with improvement” (Peter Scholtes) • Improvement is planned, fundamental change which results in unprecedented levels of performance
How to Improve Processes:Scientific Method • Make decisions based on data, rather than hunches • Look for root causes of problems rather than react to superficial symptoms • Seek permanent solutions rather than rely on quick fixes • Plan and make changes, not “ready, fire, aim”
State Desired Outcomes Opportunity Statement Process Improvement Roadmap Describe Current Situation Identify Problems Collect and Analyze Data Uncover Root Causes Generate Solutions Plan Pilot Test Check – Study/Evaluate Implement
Steps to Quality Improvement Worksheets Getting Started • Facility Self-Assessment Checklists • Identifying Areas for Improvement • Forming a Team • Team Meeting Notes
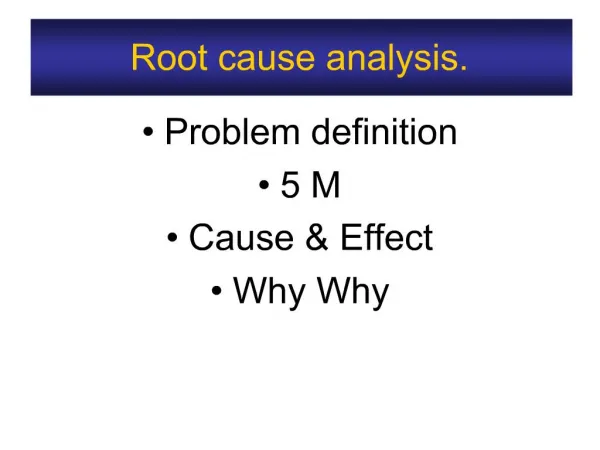
Steps to Quality Improvement Worksheets Quality Improvement Implementation • PDSA • Goal Setting • Current Process Analysis • Root Cause Analysis • Fishbone Diagram • Process Improvement Plan • Implementation Strategy • Pilot Testing • Ongoing Monitoring
PDSA Cycle What is it? • A systematic, scientific method for improving processes • Closed loop process for continuous quality improvement • One cycle flows into the next cycle using information gathered in the previous cycle When do you use it? • Used to evaluate an entire process or to target areas within a system once the problematic areas have been identified
PDSA Cycle • Plan • Do • Study • Act Plan Act Do Study
PDSA Cycle • PLAN: Decide to do something differently • DO: Observe what happens • Study: Reflect on what you observed • Act: Continue, Modify or Abandon
Root Cause Analysis A way of looking at unexpected events and outcomes to determine all of the underlying causes of the event and recommend changes that are likely to improve them. Requires Critical Thinking
Why Event Investigation is Difficult • Natural reactions to failure • Tendency to stop too soon • False belief in a single reality • “One Root Cause” Myth
Reacting to Failure Natural reactions to failure are: • Retrospective—hindsight bias • Proximal—focus on the sharp end • Counterfactual—lay out what people could have done • Judgmental—determine what people should have done, the fundamental attribution error
Stopping Too Soon • Lack training in event investigation • We don’t ask enough questions • Shallow understanding of the causes of events • Lack resources and commitment to thorough investigations
False Belief in Single Reality • People perceive events differently • Common sense is an illusion • Unique senses • Unique knowledge • Unique conclusions
The “One Root Cause” Myth • There are multiple causes to accidents • Root Cause Analysis is not about finding the one root cause • Best determined by a team rather than an individual or just one department
New View of Human Error • Human error is not the cause of events, it is a symptom of deeper troubles in the system • Human error is not the conclusion of an investigation, it is the beginning • Events are the result of multiple causes
Creating the Holes Active Failures • Errors and violations (unsafe acts) committed at the “sharp end” of the system • Have direct and immediate impact on safety, with potentially harmful effects
Creating the Holes Latent Conditions • Present in all systems for long periods of time • Increase likelihood of active failures
“Latent conditions are present in all systems. They are an inevitable part of organizational life.” James Reason “Managing the Risks of Organizational Accidents”
Root Causes • A root cause is typically a finding related to a process or system that has potential for redesign to reduce risk • Active failures are rarely root causes • Latent conditions over which we have control are often root causes
“The point of a human error investigation is to understand why actions and assessments that are now controversial, made sense to people at the time. You have to push on people’s mistakes until they make sense—relentlessly.” Sidney Dekker
How PDSA Can Help You • Guides you through steps to increase your chances of success in improving a process • Leads to ongoing improvement of methods and procedures
Tools of Quality • Fishbone Diagram • Top Down Flow Chart • Checklist • Control Chart • Pareto Chart • Scatter Diagram
Why Use Data to Make Decisions • Changes are made based on solid information rather than intuition • Provide objective measurement • Help determine the degree of the problem • Show variation and causes of variation • Help identify root causes of the problem • Help develop appropriate solutions • Baseline for determining whether the changes really made a difference
Fishbone Diagram What is it? • A cause and effect diagram, also known as an Ishikawa or "fishbone" diagram, • Graphic tool used to explore and display the possible causes of a certain effect. Use the classic fishbone diagram when causes group naturally under the categories of Materials, Methods, Equipment, Environment, and People. Use a process-type cause and effect diagram to show causes of problems at each step in the process. • Diagram that is used to display possible causes of specific problems • Represents the relationship between some “effect” and all possible “causes” When do you use it? • When you need to identify, explore and display the possible causes of a specific problem
Fishbone Diagram • A cause and effect diagram has a variety of benefits: • It helps teams understand that there are many causes that contribute to an effect. • It graphically displays the relationship of the causes to the effect and to each other. • It helps to identify areas for improvement.
Top Down Flow Chart What is it? • Chart that illustrates relationships between processes or components within a system When do you use it? • When you need to understand how a process works • When you need to identify what different factors influence a process
Steps to Quality Improvement Worksheets Quality Improvement Implementation • PDSA • Goal Setting • Current Process Analysis • Root Cause Analysis • Fishbone Diagram • Process Improvement Plan • Implementation Strategy • Pilot Testing • Ongoing Monitoring
Select Changes • How will we know that change is an improvement? • Is the selected change directly related to the problem? • Is it testable? • Can you measure the result? • Do you expect a significant impact?
Steps to Quality Improvement Worksheets Quality Improvement Implementation • PDSA • Goal Setting • Current Process Analysis • Root Cause Analysis • Fishbone Diagram • Process Improvement Plan • Implementation Strategy • Pilot Testing • Ongoing Monitoring
Fishbone Diagram What is it? • Diagram that is used to display possible causes of specific problems • Represents the relationship between some “effect” and all possible “causes” When do you use it? • When you need to identify, explore and display the possible causes of a specific problem
Implementation and Testing • Test on a small scale • Use short timeframes • Test until you have confidence in the new process • Goal is system wide change
Monitoring & Sustaining Improvement • Incorporate changes into work processes • Identify potential barriers & develop contingency plans • Monitor periodically • Assign monitor or team leader
Why do RCA? • To learn the cause(s) of a quality problem • To make changes in a process related to the causes • Reduce injury, harm or medical error in the future
Steps in Completing a Chronology • Work backward from the reason for investigation through the actions that preceded the reason for investigation. Work forward from the event to identify the post-incident actions. • After the pre-incident and post-incident sequence of events are defined and placed in sequential order, answer the following questions: • Does the time line of events adequately tell the “story” of the incident? If not the scope of the timeline may need to be extended (pre incident and/ or post incident) • Is each event derived directly from the event it precedes? If each event is not derived logically from the one preceding it, it usually indicates that one or more steps in the sequences have been left out. Add missing events to the timeline. • Is each event pertinent to the problem? Answer this question about each event in the time line. The answer may be “yes”, “no” or “not sure.” Include only the “yes” and “not sure” events in the final timeline.
Erickson’s Goals Upon Completion of the training the RCA Team will • Understand the responsibilities of the RCA Team • Understand the process for Fast Track RCA • Know the tools and reference material available for RCA • Know when to conduct Fast Track RCA and who should participate • Have practiced a Fast Track RCA • Utilized a WC and GL scenario • Utilized tools/reference material