Validity
Validity. In our last class, we began to discuss some of the ways in which we can assess the quality of our measurements. We discussed the concept of reliability (i.e., the degree to which measurements are free of random error). Why reliability alone is not enough.

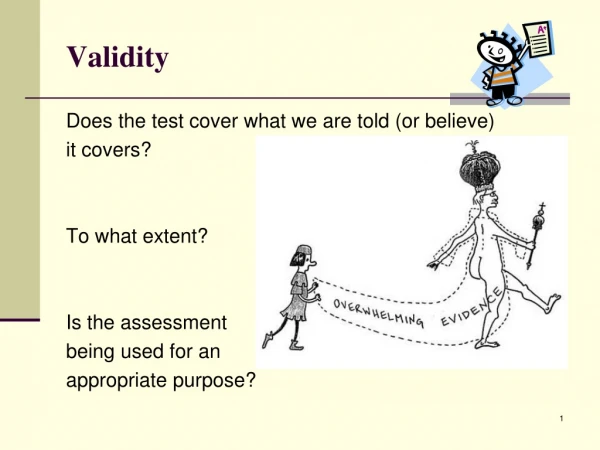
Validity
E N D
Presentation Transcript
Validity • In our last class, we began to discuss some of the ways in which we can assess the quality of our measurements. • We discussed the concept of reliability (i.e., the degree to which measurements are free of random error).
Why reliability alone is not enough • Understanding the degree to which measurements are reliable, however, is not sufficient for evaluating their quality. • In-class scale example • Recall that test-retest estimates of reliability tend to range between 0 (low reliability) and 1 (high reliability) • Note: An on-line correlation calculator is available at http://easycalculation.com/statistics/correlation.php
Validity • In this example, the measurements appear reliable, but there is a problem . . . • Validity reflects the degree to which measurements are free of both random error, E, and systematic error, S. • O = T + E + S • Systematic errors reflect the influence of any non-random factor beyond what we’re attempting to measure.
Validity: Does systematic error accumulate? • Question: If we create a composite of multiple observations, how will systematic errors influence our estimates of the “true” score?
Validity: Does error accumulate? • Answer: Unlike random errors, systematic errors accumulate. • Systematic errors exert a constant source of influence on measurements. We will always overestimate (or underestimate) T if systematic error is present.
Note: Each measurement is 2 points higher than the true value of 10. The errors do no average out.
Note: Even when random error is present, E averages to 0 but S does not. Thus, we have reliable measures that have validity problems.
Validity: Ensuring validity • What can we do to minimize the impact of systematic errors? • One way to minimize their impact is to use a variety of indicators—different sources of information. • Different kinds of indicators of a latent variable may not share the same systematic errors • If true, then S will behave like random error across measurements (but not within measurements)
Example • As an example, let’s consider the measurement of self-esteem. • Some methods, such as self-report questionnaires, may lead people to over-estimate their self-esteem. Most people want to think highly of themselves. • Other methods, such as clinical ratings by trained observers, may lead to under-estimates of self-esteem. Clinicians, for example, may be prone to assume that people are not as well-off as they say they are.
Self-reports Clinical ratings Note: Method 1 systematically overestimates T whereas Method 2 systematically underestimates T. In combination, however, those systematic errors cancel out.
Another example • One problem with the use of self-report questionnaire rating scales is that some people tend to give high (or low) answers consistently (i.e., regardless of the question being asked). • This is sometimes referred to as a “yay-saying” or “nay-saying” bias. Acquiescence
1 = strongly disagree | 5 = strongly agree In this example, we have someone with relatively high self-esteem, but this person systematically rates questions one point higher than he or she should.
1 = strongly disagree | 5 = strongly agree If we “reverse key” half of the items, the bias averages out. Responses to reverse keyed items are counted in the opposite direction. T: (4 + 4 + [6-2] + [6-2]) / 4 = 4 O: (5 + 5 + [6-3] + [6-3]) / 4 = 4
Validity • To the extent to which a measure has validity, we say that it measures what it is supposed to measure • Question: How do you assess validity? ** Very tough question to answer! **
Different ways to think about validity • To the extent that a measure has validity, we can say that it measures what it is supposed to measure. • There are different reasons for measuring psychological variables. The precise way in which we assess validity depends on the reason that we’re taking the measurements in the first place.
Prediction • As an example, if one’s goal is to develop a way to determine who is at risk for developing schizophrenia, one’s goal is prediction.
Predictive Validity • We may begin by obtaining a group of people who have schizophrenia and a group of people who do not. • Then, we may try to figure out which kinds of antecedent variables differentiate the two groups.
Predictive Validity • In short, some of these variables appear to be better than others at discriminating schizophrenics from non-schizophrenics • The degree to which a measure can predict what it is supposed to predict is called its predictive validity. • When we are taking measurements for the purpose of prediction, we assess validity as the degree to which those predictions are accurate or useful.
No 40 10 80% ( [40 + 40] / 100) people were correctly classified (50% base rate) Reality: Schizophrenic Yes 10 No Measure: Schizophrenic 40 Yes
Reality: Schizophrenic No Yes 10 10 No Measure: Schizophrenic 40 40 Yes 50% ( [40 + 10] / 100) people were correctly classified (with a 50% base rate. Yuck.)
Reality: Schizophrenic No Yes 98 0 No Measure: Schizophrenic 1 1 Yes 99% ( [98 + 1] / 100) people were correctly classified, but note the base rate problem. Cohen’s kappa is used to account for this problem. Kappa in this example is 66%
Construct Validity • Sometimes we’re not interested in measuring something just for “technological” purposes, such as prediction. • We may be interested in measuring a construct in order to learn more about it • Example: We may be interested in measuring self-esteem not because we want to predict something with the measure per se, but because we want to know how self-esteem develops, whether it develops differently for males and females, etc.
Construct Validity • Notice that this is much different than what we were discussing before. In our schizophrenia example, it doesn’t matter whether our measure of schizophrenia really measured schizophrenic tendencies per se. • As long as the measure helps us predict schizophrenia well, we don’t really care what it measures.
Construct Validity • When we are interested in the theoretical construct per se, however, the issue of exactly what is being measured becomes much more important. • The general strategy for assessing construct validity involves (a) explicating the theoretical relations among relevant variables and (b) examining the degree to which the measure of the construct relates to things that it should and fails to relate to things that it should not.
Nomological Network • The nomological network represents the interrelations among variables involving the construct of interest. achieve in school ability to cope + + self- esteem - distrust friends
Nomological Network & Validity • The process of assessing construct validity basically involves determining the degree to which our measure of the construct behaves in the way assumed by the theoretical network in which it is embedded. • If, theoretically, people with high self-esteem should be more likely to succeed in school, then our measure of self-esteem should be able to predict people’s grades in school.
Construct Validity • Notice here that establishing construct validity involves prediction. The difference between prediction in this context and prediction in the previous context is that we are no longer trying to predict school performance as best as we possibly can. • Our measure of self-esteem should only predict performance to the degree to which we would expect these two variables to be related theoretically.
Discriminant Validity • The measure should also fail to be related to variables that, theoretically, are unrelated to self-esteem. • The ability of a measure to fail to predict irrelevant variables is referred to as the measure’s discriminant validity. achieve in school ability to cope + + self- esteem 0 - like coffee distrust friends
Validity: Assessing validity • Finally, it is useful, but not necessary, for a measure to have face validity. • Face validity: The degree to which a measure appears to measuring what it is supposed to measure. • A questionnaire item designed to measure self-esteem that reads “I have high self-esteem” has face validity. An item that reads “I like cabbage in my Frosted Flakes” does not. • In the context of prediction, face validity doesn’t matter. In the context of construct validity, it matters more.
A Final Note on Construct Validity • The process of establishing construct validity is one of the primary enterprises of psychological research. • When we are measuring the association between two variables to assess a measure’s predictive or discriminant validity, we are evaluating both (a) the quality of the measure and (b) the soundness of the nomological network. • It is not unusual for researchers to refine the nomological network as they learn more about how various measures are inter-related.