Download
1 / 92
940 likes | 1.15k Vues
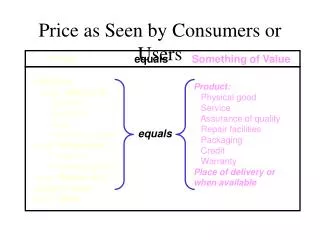
Price as Seen by Consumers or Users. Price equals Something of Value. List price Less: discounts Quantity Seasonal Cash Temporary sales Less: allowances Trade-ins Damaged goods Less: Rebate and coupon value

E N D
Price as Seen by Consumers or Users Price equals Something of Value List price Less: discounts Quantity Seasonal Cash Temporary sales Less: allowances Trade-ins Damaged goods Less: Rebate and coupon value Plus: Taxes Product: Physical good Service Assurance of quality Repair facilities Packaging Credit Warranty Place of delivery or when available equals
Price as Seen by Channel Members Price equals Something of Value Product: Branded--well known Guaranteed Warranted Service--Repair facilities Convenient packaging Place Availability--when and where Price Price-level guarantee Sufficient margin Promotion: Promotion to consumers List price Less: discounts Quantity Seasonal Cash Trade/functional Temporary deals Less: allowances Promotion Damaged goods Stocking Plus: Taxes and tariffs equals
Exchange Rates for Various Currencies against the U.S. Dollar Over Time * Units shown are the average for each year 1985-1997. For 1998, units shown are for June 16, 1998.
Discount Policies • DISCOUNTS are reductions from list price that are given by a seller to a buyer who either gives up some marketing function or provides the function himself • Quantity discounts • Cumulative quantity discounts encourage repeat purchases and relationships • Noncumulative encourage large orders • Seasonal discounts smooth out demand • Cash discounts encourage early payment • Trade (functional) discounts go to middlemen
Geographic Pricing Policies • "Free on Board" (F.O.B) at some place • Examples: • F.O.B. seller's factory • F.O.B. delivered • F.O.B. factory—freight prepaid • Zone Pricing: an average freight charge to all buyers within specific geographic areas • Uniform Delivered Pricing: the same (average) freight charge to all buyers • Freight Absorption Pricing: seller pays freight cost so delivered price matches competition
Pricing Policies Combine to Impact Customer Value • Customer value considers total costs and benefits • Costs and benefits are impacted not only by list price but by • Discounts • Allowances • Delivery terms and geographic pricing policies • Sales and deals • Price flexibility (and transaction costs) • Value pricing leads to superior customer value • Value pricing is setting a fair price level for a marketing mix that really gives the target market superior customer value
Robinson-Patman Act • Regulates price discrimination—selling the same products to different buyers at different prices • if it injures competition • Cost differences can justify prices differences • analysis must have been done in advance • You can match a competitor's prices • Functional discounts are usually ok • Does not apply to sales to final consumers
Markups • Dollar amount added to the cost of the products to get the selling price • Markup percent is the percentage of selling price that is added to the cost to get the selling price • percent of selling price unless otherwise noted • Products may be marked up several times through the channel • the sequence of markups is the markup chain • High markups don't always mean high profits • depends on the stockturn rate
Average-Cost Pricing • Adds a "reasonable" markup to the average cost of a product • Simplifies pricing • Quite common, especially among middlemen • Usually based on estimates or past records • actual average cost depends on quantity sold! • quantity sold depends on price
Experience Curve Pricing • A type of average-cost pricing using an estimate of future average costs • Often leads to low prices if future economies of scale are expected • costs may drop with accumulated production experience • Can be very risky if costs do not drop, or if expected volume is not achieved
Break-Even Analysis • Used to evaluate whether the firm will be able to cover costs (break even) at a particular price • Indicates the break-even point—sales (units or dollars) needed to break even • Can be modified to incorporate a target return • Problems: • assumes any quantity can be sold at a given price • total cost curve is assumed to be a straight line
Cost Structure for Individual Firm (fill in the missing numbers)
Cost Structure for Individual Firm (with missing numbers filled in)
Evaluating a Customer’s Price Sensitivity Value-in-use pricing Auctions including online Reference prices Leader pricing Bait pricing Psychological pricing odd-even pricing price lining Demand-backward pricing Prestige pricing Full-line pricing complementary pricing bundle pricing Demand-Oriented Pricing Approaches
Evaluating a Customer’s Price Sensitivity • Are there substitute ways of meeting a need? • Is it easy to compare prices? • Who pays the bill? • How great is the total expenditure? • How significant is the end benefit? • Is there already a sunk investment related to the purchase?
Value in Use Pricing • Sets prices that will capture some of what customers will save by substituting the firm's product for the one the customer is currently using • Example: A construction firm that buys a new, more efficient bulldozer at a higher price might still save money on: • labor (operator) expenses • "down-time" for repairs • fuel consumption • maintenance costs
Implementation and Control • Faster feedback (because of information technology) is resulting in more rapid changes • Marketing manager must take charge to get information that is needed • Can be a source of competitive advantage • Good implementation means that plans work as intended • Builds relationships with customers
Implementation Objectives • Innovative thinking and approaches may help the marketing manager overcome challenges and better achieve major implementation objectives • Better, so customers really get superior value as planned • Faster, to avoid delays that cause customers problems • Lower cost, without wasting money on things that don't add value for the customer
Examples of Approaches to Overcome Specific Marketing Implementation Problems
Total Quality Management • Everyone in the organization is concerned about quality, throughout all of the firm's activities, to better serve customer needs • The cost of poor quality is lost customers • Achieving quality requires continuous improvement—a commitment to constantly make things better one step at a time • Uses statistical process controls to identify problems. Examples: • Pareto charts • Fishbone diagrams • "Slay the dragons first"... to get a return on quality • Specify jobs and benchmark performance
Building Quality into Services • Every firm must implement service quality as part of its plan, whether its product is primarily a service, primarily a physical good, or a combination of both • Can't simply "inspect in" quality—must be there from the start • Ongoing training is critical (plan for the special) • Empower employees to correct a problem without first checking with management
Marketing Control • Feedback process that helps the marketing manager learn • how ongoing plans and implementation are working • how to plan for the future • Sales Analysis looks at details of where sales come from • customers • products • territories, etc. • Performance Analysis compares actual with targets • Cost Analysis controls spending
Some Bases for Sales, Cost, or Profit Analysis • Geographic region • Product (package size, style, etc.) • Customer size • Customer type or class of trade • Price or discount class • Method of sale • Cash or charge (financial arrangement) • Size of order • Commission class
Cost Analysis • Must understand costs to control them • Analyzing and dealing with fixed costs can be a challenge • full-cost approach allocates fixed costs • contribution-margin approach is an alternative • two approaches have different benefits, limitations
Profit and Loss Statement by Department if Department 1 Were Eliminated
Example of a Planning and Control Chart: Cindy’s Fashions - Dept. B
Marketing Audit • A systematic, critical, and unbiased review and appraisal of the basic objectives and policies of the marketing function—and of the organization, methods, procedures, and people employed to implement the policies • Should not be necessary, but usually is • May require objective, outside experts
Marketing's Link with Other Functional Areas • Link with other functional areas affects strategy planning as well as implementation and control • Finance • Money for initial investment and ongoing expenses • Production • Flexibility, costs of products offered • Accounting • Understanding costs and profits of decisions • Human resources • People to do the work that needs to be done
Finance Function Manages Capital • Capital is the money invested in a firm • Investments in fixed assets (facilities, etc.) • Working capital: money to pay for short term expenses such as salaries, advertising, marketing research, etc. • Capital may come from internal or external sources • External funding (investors): sales of stock or debt • Internal funding: profits and cash flow
Coordinate Marketing Plan and Production • Production capacity takes many forms • Quantity and quality of specific goods or services the firm is able to produce • Production flexibility may limit or increase opportunities • Virtual corporation • Perhaps more flexibility but less control • Mass customization • Tailors production to needs of individual customers • Price must cover production costs • Cut costs that don't add value for customers
Accounting Data Helps to Understand Costs and Profit • Traditional accounting data often are not helpful for making strategy planning decisions • Activity-based accounting may help • Allocates costs from natural accounts to functional accounts • Natural accounts • Categories to which costs are charged in the normal accounting cycle • Often of limited value for marketing control • Functional accounts • Shows costs arranged by the purpose for which expenditures were made
Human Resources: People Put Plans into Action • Traditional issues include selection, training, supervision, motivation, and compensation • New strategy usually requires people changes • New strategy must be communicated • Rapid change may cause strain • Time for training • Time for required activities
Factors that Affect Marketing Mix Planning • Product classes—how are products that consumers see in the same way typically marketed? • Stage of product life cycle • Size and geographic concentration of customers • Value of item and frequency of purchase • Preferences for personal contact • Perishability • Technical complexity
Typical Changes in Marketing Variables over the Product Life Cycle • Competition: becomes more intense, moves toward pure competition • Product: typically moves toward more variety, and then less variety in decline stage • Place: typically moves toward more intensive distribution • Promotion: emphasis changes from primary demand to selective demand, and becomes more frantic • Price: moves toward more price cutting and dealing
Market Potential and Sales Forecast • Market Potential—what a whole market segment might buy • Sales Forecast—an estimate of how much an industry or firm hopes to sell to a market segment
Approaches to Forecasting • Extending past behavior • Trend extension • Assumes future patterns will be like past patterns • Factor method • Based on finding a variable (a factor) that is related to the variable being forecast • Multiple factors may be helpful • Example: Buying Power Index • Leading series • Factors that move in advance of what is being forecast