Vegetation Plot Management: A National Plots Database Demo
490 likes | 625 Vues
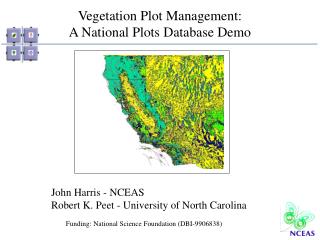
Vegetation Plot Management: A National Plots Database Demo. John Harris - NCEAS Robert K. Peet - University of North Carolina. Funding: National Science Foundation (DBI-9906838). Agenda: Over-Arching Concepts Project Overview · Impact · Database Design · System Architecture

Vegetation Plot Management: A National Plots Database Demo
E N D
Presentation Transcript
Vegetation Plot Management: A National Plots Database Demo • John Harris - NCEAS • Robert K. Peet - University of North Carolina Funding: National Science Foundation (DBI-9906838)
Agenda: Over-Arching Concepts Project Overview · Impact · Database Design · System Architecture · Challenges Use-Case Example: Wisconsin Data Data Management Recommendations Future Directions
The US National Plots Database Project organized and conducted by: Robert K. Peet, University of North Carolina Marilyn Walker, USDA Forest Service & U. Alaska Dennis Grossman, The Nature Conservancy / ABI Michael Jennings, USGS-BRD & UCSB John Harris, NCEAS Project supported by: National Center for Ecological Analysis & Synthesis U.S. National Science Foundation USGS-BRD Gap Analysis Program ABI / The Nature Conservancy
Publication Analysis Extraction Archival Integration Collection
Preliminary design Build prototype #1 interface Build prototype #n interface User evaluates interface Design modification are made Evaluation studied by designer Development Cycle Supported by 3 other NCEAS Developers Database Design: Aug. 2000 – Jan. 2001 Interface Design: Nov. 2000 – Feb. 2001 Backend Development: Jan. 2001 - Interface Development: Mar. 2001 – Backend Version: Prototype 3 Interface Version: Prototype 1 Expected Beta Release: Late Sept. – Mid Oct.
Plots Database Design Goals • Support the National Vegetation Classification. • Provide a comprehensive facility to store the most • commonly collected vegetation plot data attributes. • Provide the user with a large number of user-defined • attributes to store not-so-commonly collected data. • Integrate plots with the dynamic plant taxonomy • and vegetation community data. • Design meeting September 2000, NCEAS
Taxonomy Module • Smithsonian meeting: • Peet-Taswell model vs Berendsohn model • FGDC Biological Nomenclature Working Group • Update on ABI & HDMS • Prospects for implementation • The difficult choice
Taxonomy Database Design Goals • Logical separation of a "taxonomic name" with the "taxonomic concept", so that taxonomic data can be stored at the most 'atomic' level without ambiguity • The ability to incorporate multiple organizations' 'views' of how a taxonomic name is applied to a taxonomic concept • The ability to link a taxonomic name used in the Plots database with a 'name - concept' pair in the taxonomic • database. • *Although one can store vegetation community data in the same database table-structure as the plant • taxonomy database, we have implemented two separate table structures and have created two separate data sets.
Development Choices Representative tools reflect the desire to have the following features: High performance Robust Open architecture Platform neutral Scaleable
Features - JAVA • Java -- Write once, Cross platform – Linux, Windows, MacOS* • Java Servlet -- Dynamic, database-driven, • web content • JDBC -- Connect to any database - Oracle, PostgreSql, SQL Server backend • Swing -- Classy interface tools • Beans -- Reusable components * Not tested yet :-)
Features - XML XML: is the format for structured data on the Web. Simple and flexible data conversions, using XSLT Straightforward to write generic tools which export parts of a relational database as XML encoded data, or even to write generic code that serializes Java (or other) objects as XML data structures. Examples later…
An Example Workflow Using Wisconsin Plots Data What data integration means to us Taxonomic / Semantic Integration Data formatting for database ingestion General Comments about Current Format Data Parsing Transformation to XML standard Legacy Data Loader
Integration Plots Data Integration & DB Ingestion Reformat by Hand Research MS Access MS Excel Perl Shell scripts ? Plots DB What is meant by data integration? …
Carya carolinae-sept. (Ashe) Engler & Graebner Carya ovata (Miller)K. Koch Carya ovata (Miller)K. Koch Integration Taxonomic Integration sec. Gleason 1952 sec. Radford et al. 1968 Splitting one species into two illustrates the ambiguity often associated with scientific names. If you encounter the name “Carya ovata (Miller) K. Koch” in a database, you cannot be sure which of two meanings applies.
Integration Semantic Integration of Plot Attributes ‘Basic yet Important’ Cover Scales Strata Dimensions Environmental Attributes
Parse Data from Forms into Table Structure to be Transformed into XML Consistent with the Database Structure Text Forms Columnar Tables Integration XML
Parsed Data Text Forms Columnar Tables Integration
Transform Parsed Data to XML Consistent with the Plots Database Columnar Tables Integration Legacy Data Loader Plots DB XML Data Definition (XML)
Data Definition (XML) – Single file Integration <plotDataPackage> <plotDataFile> <fileName>siteData.csv</fileName> <attributeDelimeter>’,’</attributeDelimeter> <fileTheme> site data </fileTheme> <attribute> <attributeName>plotCode</attributeName> <plotDBAttribute>authorPlotCode</plotDBAttribute> <attributePosition>1</attributePosition> </attribute> <attribute> <attributeName>communityName</attributeName> <plotDBAttribute>communityName</plotDBAttribute> <attributePosition>2</attributePosition> </attribute> … <state> </plotDataFile> </plotDataPackage>
Data Definition (XML) – Multiple files Integration <plotDataFile> <fileName>vegData.csv</fileName> <constraint> <fileName>siteData.csv</fileName> <themeName> site data </themeName> <attributeName>authorPlotCode</attributeName> <cardnality>'+'</cardnality> </constraint> <attributeDelimeter>‘,’</attributeDelimeter> <fileTheme>species</fileTheme> <attribute> <attributeName>plotName</attributeName> <plotDBAttribute>authorPlotCode</plotDBAttribute> <attributePosition>1</attributePosition> </attribute> <attribute> <attributeName>scientificName</attributeName> <plotDBAttribute>taxonName</plotDBAttribute> <attributePosition>2</attributePosition> </attribute>
Plots Database XML Integration <strata> <stratumCover> </stratumCover> <stratumHeight> </stratumHeight> </strata> <taxonObservations> <authNameId> </authNameId> <originalAuthority> </originalAuthority> <strataComposition> <strataType> </strataType> <percentCover> </percentCover> </strataComposition> </taxonObservations> <communityType> <classAssociation> </classAssociation> <classQuality> </classQuality> <startDate> </startDate> <stopDate> </stopDate> </communityType> </plotObservation> <plotContributor> <role> </role> <party> </party> </plotContributor> </plot> <plot> <authorPlotCode> </authorPlotCode> <plotType> </plotType> <samplingMethod> </samplingMethod> <plotOriginLat> </plotOriginLat> <plotOriginLong> </plotOriginLong> <plotShape> </plotShape> <plotSize> </plotSize> <plotSizeAcc> </plotSizeAcc> <altValue> </altValue> <altPosAcc> </altPosAcc> <slopeAspect> </slopeAspect> <slopeGradient> </slopeGradient> <slopePosition> </slopePosition> <hydrologicRegime> </hydrologicRegime> <soilDrainage> </soilDrainage> <surfGeo> </surfGeo> <plotObservation> <previousPlot> </previousPlot> <plotStartDate> </plotStartDate> <plotStopDate> </plotStopDate> <dateAccuracy> </dateAccuracy> <effortLevel> </effortLevel>
General Data Management Practices general formats weird formats unusable formats modeled the software after the way that people collect plots data -- at least that is what I thought At times tortuous path to the database in terms of reformating class indicies (these are rectified at the plots loading software step)
Management Case: Example from Wisconsin • Baraboo Hills -- Collected Yesterday • PEL -- Legacy Data