Download
1 / 29
290 likes | 295 Vues
JM Financial is a leading investment banking firm in India. We offer services like Investment Banking, Equity, Commodity Sales and Trading, Wealth Management, Portfolio Management Services, Asset Management, Alternative Asset Management, Financing and Lending, Housing Finance and Distressed Asset Management Visit our website today! https://jmfl.com/

E N D
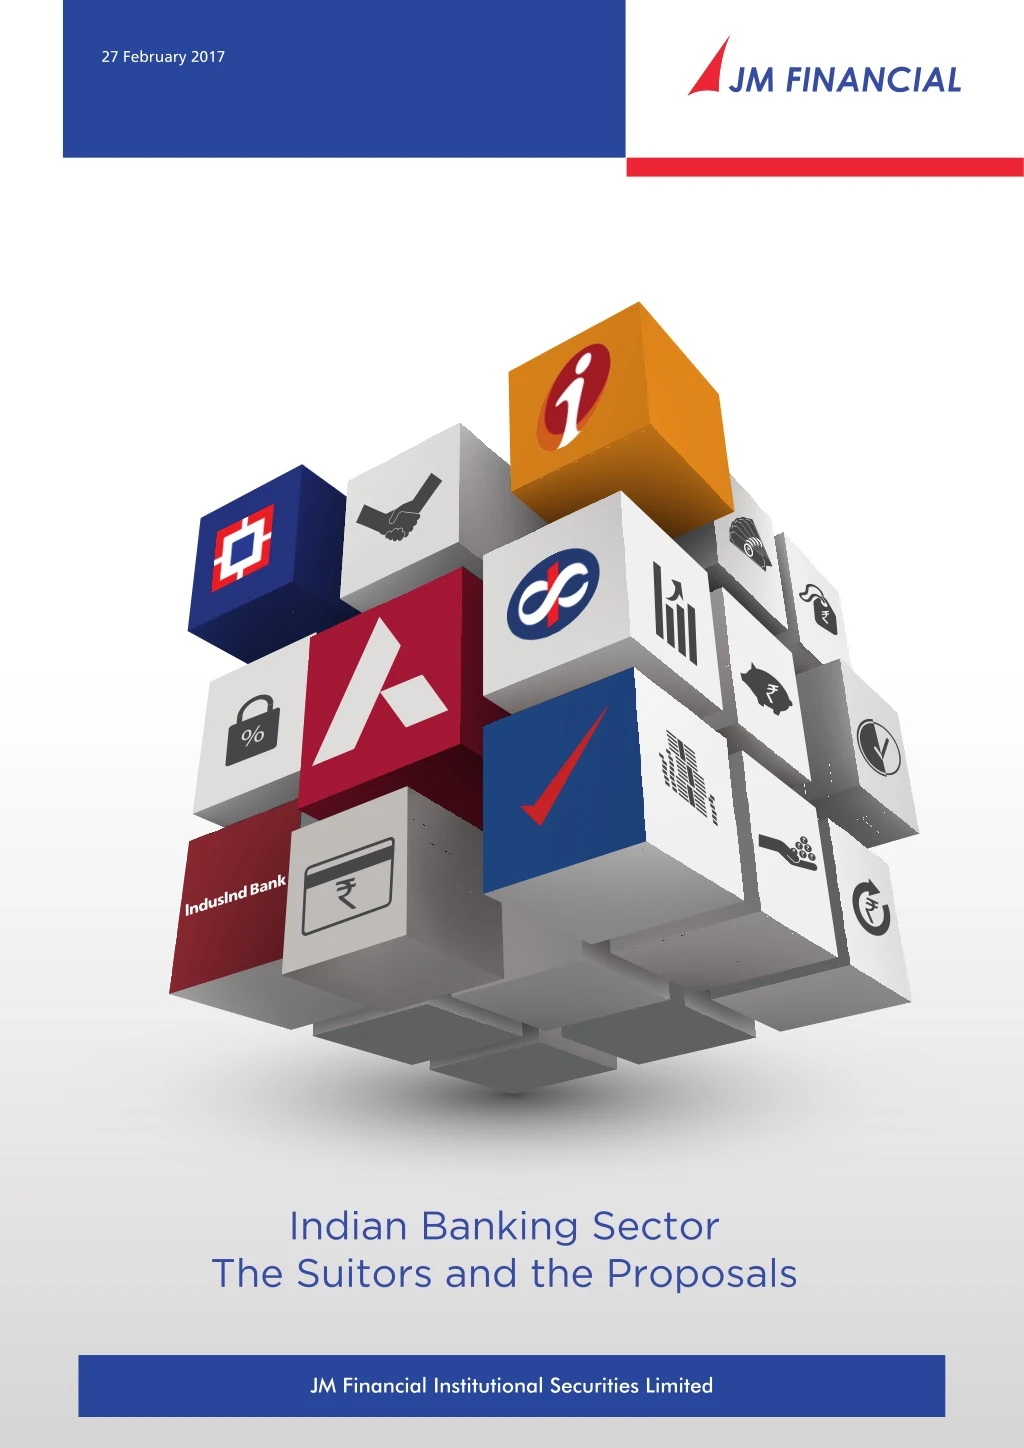
27 February 2017 India | Banking sector | Sector Report Indian Indian Banking sector Banking sector The The S Suitors and the uitors and the P Proposals roposals Abhishek Murarka Abhishek Murarka There has been There has been multiple media (KMB) with Axis Bank (AXSB). While it is (KMB) with Axis Bank (AXSB). While it is impossible might be useful to know what the landscape would look like if a merger might be useful to know what the landscape would look like if a merger does have analysed the potentia have analysed the potential inclinations and reservations that each of the large private sector l inclinations and reservations that each of the large private sector banks, viz. ICICI Bank (ICICIBC), HDFC Bank (HDFCB), Indusind Bank (IIB) banks, viz. ICICI Bank (ICICIBC), HDFC Bank (HDFCB), Indusind Bank (IIB), , YES Bank (YES) KMB KMB would have in viewing AXSB as a potential acquisition target. AXSB is currently the third would have in viewing AXSB as a potential acquisition target. AXSB is currently the third largest private sector bank in India. A merger with or acquisition of AXSB would alter the largest private sector bank in India. A merger with or acquisition of AXSB would alter the banking banking landscape and allow the acquirer to leapfrog several years into their individual landscape and allow the acquirer to leapfrog several years into their individual planning cycles planning cycles. This would also be a threat to other banks which would eit . This would also be a threat to other banks which would either see a new challenge from a larger competitor or lose out on a potential opportunity to multiply challenge from a larger competitor or lose out on a potential opportunity to multiply their market share. However, a merger would come with its own share of challenges in market share. However, a merger would come with its own share of challenges in integration, management of stressed loans and weakening of profitabilit integration, management of stressed loans and weakening of profitability profile in the medium term. The three mid medium term. The three mid- -sized banks, i.e., KMB, IIB and YES each stand to benefit from sized banks, i.e., KMB, IIB and YES each stand to benefit from the merger in different ways. the merger in different ways. multiple media reports reports about a potential merger of Kotak Mahindra Bank about a potential merger of Kotak Mahindra Bank impossible to comment on what to comment on what will abhishek.murarka@jmfl.com | +91-22-66303263 will happen, it happen, it does happen. We happen. We Jayant Jayant Kharote Kharote jayant.kharote@jmfl.com | +91-22-66303099 Karan Uberoi Karan Uberoi YES Bank (YES) and and karan.uberoi@jmfl.com | Tel: (91 22) 66303082 Nikhil Walecha Nikhil Walecha nikhil.walecha@jmfl.com | Tel: (91 22) 66303027 her see a new their y profile in the Who would be most interested in a merger Who would be most interested in a merger? ? Analysing the banks, viz. ICICIBC, HDFCB, IIB, KMB and YES would be the only contenders for a merger. Other private banks are too small and Public sector banks are not even in the fray, having enough battles of their own to fight. AXSB offers a strong retail assets and liabilities franchise, well-spread branch network, diversified fee income and market leading efficiency and productivity parameters. However, it comes with a large stressed corporate portfolio, increasing pace of slippages outside the watch-list and potentially high loan loss provisioning in FY18E/19E as well. We weigh the challenges and benefits for the banks above to shorten the list of potential acquirers. Analysing the fit, fit, bank bank- -wise wise: : Five private Acquisition of / merger with AXSB Acquisition of / merger with AXSB – – A Quantum leap for all acquisition of AXSB would add 4.3% to the acquirers loans market share, 3.4% to their deposit market share, c.6.6% to the market share in ATMs and similarly for credit cards, debit cards, mobile transactions, etc. The merger would add many years’ worth of growth to the balance sheet. For instance, at a loan CAGR of 20%, KMB would take 6.4 years to reach the post merger scale! The merger would greatly diversify the branch presence by region (North/South/East/West) and increase rural penetration. An acquirer would get strong foothold in South Indian region which has higher penetration of regional banks. Product complentarities and acquisition of large secured retail portfolio would be other attractions for an acquirer. A Quantum leap for all: : A merger with or an Benefits and Benefits and challen would be much more for the mid-sized banks like KMB, IIB and YES. These would benefit substantially from the higher savings account (SA) ratio of AXSB. Having achieved critical scale after a merger, the acquirer could drop their differential SA rates in-line with the large banks. This would be margin accretive. A large customer base with strong liability relationships would offer the perfect opportunity to increase the cross-sell intensity. On the other hand, acquisition of 12.8% of impaired loans and increased risk concentration would have to be managed. KMB and YES could also face a cost implication as the ratio of their staff costs per employee is 36%/28% higher than that for AXSB. challenges of the merger with AXSB: ges of the merger with AXSB: The benefits of merging with AXSB Profitability impact and dilution in prom Profitability impact and dilution in promoter shareholding: and RoE of 6.1% are significantly lower than those for other private banks. The financial performance in FY18E would still remain weak, despite expectations of a recovery. A merger would therefore dilute the performance metrics of other private banks substantially over FY18E-19E at least. Integration challenges would probably keep financial performance weaker for longer. Another challenge is the sharp dilution in promoter shareholding of KMB, IIB and YES. While the dilution would be welcome for KMB, IIB or YES would have to contend with steep dilution in shareholding. oter shareholding: AXSB’s 9MFY17 RoA of 0.6% JM Financial Research is also available on: Bloomberg - JMFR <GO>, Thomson Publisher & Reuters S&P Capital IQ and FactSet Please see Appendix I at the end of this report for Important Disclosures and Disclaimers and Certification. Research Analyst JM Financial Institutional Securities Limited JM Financial Institutional Securities Limited
27 February 2017 Banking sector Banking sector Contents Contents Analysing the fit, bank-wise ...........................................................................6 HDFCB – More challenges than benefits ( X ) .................................................... 6 ICICIBC – No meaningful gain from acquisition ( X ) .......................................... 6 KMB – Several synergies would come into play, but challenges too ( ) ....... 6 IIB – Complementarities exist, could be a meaningful acquisition ( ) .......... 7 YES – Big all-round gains, promoter dilution would be an impediment ( ) .. 8 Acquisition of / merger with AXSB – A Quantum Leap for all ...........................9 Leapfrogging 6-7 years into the future .............................................................. 9 Significant complementarities in branch network, products and loans .......... 11 Benefits and challenges of a merger with AXSB ............................................. 16 Synergies to make combined entity a corporate and retail powerhouse ....... 16 CASA ratio would improve substantially, should lead to drop in SA rates ...... 17 Cost impact of merger would make it imperative to rationalize rapidly ......... 18 Non-interest income would become more diversified .................................... 19 Asset quality resolution and recognition ......................................................... 20 Profitability impact, dilution in key metrics ................................................... 23 Steep dilution in promoter shareholding would be a disincentive to merge .. 24 Annexures ................................................................................................... 26 JM Financial Institutional Securities Limited Page 2
27 February 2017 Banking sector Banking sector Exhibit Exhibit 1. 1. JMFL: Indian Banks JMFL: Indian Banks valuation matrix Company Company valuation matrix Price Price Mkt Cap Mkt Cap Target ( Target (` `) ) P/E (x) P/E (x) P/B (x) P/B (x) Ro RoE E Reco Reco Upside Upside FY17E FY18E FY19E FY17E FY18E FY19E ( ($mn) $mn) FY17E FY17E FY18E FY18E FY19E FY19E Government Banks Government Banks 5.6% 8.9% 164 5,677 18 11 8 1.0 0.9 0.8 11.3% HOLD 187 14% BOB 140 4,454 8 5 9 0.7 0.6 0.7 8.2% 13.7% 8.1% SELL 112 -20% PNB 268 32,056 27 18 10 1.1 1.1 1.0 4.2% 5.9% 9.7% BUY 304 13% SBI (Consolidated) 268 32,056 18 11 11 1.3 1.2 1.1 7.9% 11.6% 10.9% BUY 304 13% SBI (Standalone) New Private Banks New Private Banks 509 18,247 23 15 12 2.1 1.9 1.7 9.5% 13.3% 15.0% BUY 530 4% AXSB 1,394 53,470 24 21 17 4.2 3.6 3.1 18.7% 19.0% 19.5% BUY 1492 7% HDFCB 279 24,331 15 13 10 1.6 1.5 1.4 11.7% 12.0% 14.3% BUY 328 18% ICICIBC (Consolidated) 279 24,331 16 19 15 1.7 1.6 1.5 11.7% 9.0% 10.5% BUY 328 18% ICICIBC (Standalone) 801 22,073 30 27 23 3.9 3.4 2.9 13.7% 13.6% 14.0% HOLD 900 12% KMB (Consolidated) 801 22,073 43 39 32 5.4 4.8 4.2 13.2% 13.1% 13.9% HOLD 900 12% KMB (Standalone) 1,422 9,022 21 16 11 3.0 2.6 2.5 17.9% 17.1% 24.7% BUY 1610 13% YES 1,319 11,825 27 22 17 4.0 3.4 2.9 15.9% 16.9% 18.5% BUY 1572 19% IIB Source: JM Financial; Prices as of Feb 27th, 2017 Exhibit Exhibit 2. 2. JMFL: Indian Banks/Financials valuation matrix JMFL: Indian Banks/Financials valuation matrix Company Company BVPS Adj. BVPS EPS EPS Growth FY17E FY18E FY19E FY17E FY18E FY19E FY17E FY18E FY19E FY17E FY18E FY19E Public Sector Banks Public Sector Banks 164 178 197 83 118 146 9 15 21 -138% 70% 40% BOB 213 233 203 29 65 84 16 29 16 97% 78% -46% PNB 242 255 276 117 145 180 10 15 26 -38% 51% 74% SBI (Consolidated) 203 228 236 147 163 190 15 25 25 19% 61% 0% SBI (Standalone) New Private Banks New Private Banks 239 269 293 190 208 255 22 34 41 -37% 55% 22% AXSB 332 383 445 325 374 435 58 68 81 19% 17% 19% HDFCB 171 185 205 144 160 189 19 21 28 10% 11% 31% ICICIBC (Consolidated) 162 174 187 134 150 173 17 15 19 5% -14% 26% ICICIBC (Standalone) 208 237 272 208 237 272 27 30 36 41% 13% 18% KMB (Consolidated) 148 168 191 148 168 191 18 21 25 62% 12% 21% KMB (Standalone) 474 541 575 378 455 553 69 87 129 14% 26% 49% YES 333 385 449 326 375 439 50 61 77 29% 22% 27% IIB Source: JM Financial, Prices as of Feb 27th, 2017 JM Financial Institutional Securities Limited Page 3
27 February 2017 Banking sector Banking sector Exhibit 3. Comparison between banks on a standalone basis (Please refer to relevant Annexures for details of ranking) HDFC HDFCB B Scale Rank Scale Rank (based on Total Assets) 1 1 ICICIBC ICICIBC 2 2 AXSB AXSB 3 3 KMB KMB 4 4 IIB IIB 6 6 YES YES 5 5 Rural & Semi Urban Urban & Metro Rural branches: penetration of 32.7 41.0 44.5 45.6 48.5 49.3 51.5 50.7 54.4 55.5 59.0 67.3 5.7 North West South East & N-East Central 8.7 12.2 5.312.3 14.6 13.2 18.0 19.6 24.3 25.1 28.4 30.2 Regional distribution: Branch 42.0 13.3 12.6 18.3 13.9 14.3 35.0 21.0 30.9 23.1 21.7 26.2 22.3 21.0 16.9 23.2 26.6 11.2 14.3 15.7 16.2 16.0 15.9 CA SA Other deposits 22.2 Liabilities profile 21.1 50.1 52.4 25.8 54.6 29.4 58.0 31.8 63.0 35.6 66.7 8.6 37.0 39.9 Loan book – Retail vs non-Retail 41.7 Retail Non-Retail 48.9 46.3 51.1 53.7 58.3 60.1 63.0 91.4 Term loans / total loans Other loans / total loans 22.3 25.2 27.2 30.6 30.7 29.9 Loan book – Term vs. Working capital 69.4 69.3 70.1 72.8 74.8 77.7 Efficiency Rank Efficiency Rank Productivity Rank Productivity Rank (GNPA + Restructured (GNPA + Restructured loans) / Total loans loans) / Total loans 5yr Avg. ROA 5yr Avg. ROA 5yr Avg.ROE 5yr Avg.ROE Tier 1 CAR Tier 1 CAR CAR CAR (Annex 2) (Annex 3) (%) 4 4 1 1 2 2 4 4 2 2 4 4 2 2 3 3 1 1 5 5 6 6 4 4 1.2 1.2 9.6 9.6 7.7 7.7 2.1 2.1 1.4 1.4 1.3 1.3 (%, FY12-16) (%, FY12-16) (%, 3QFY17) (%, 3QFY17) 1.8 1.8 19.6 19.6 15.3 15.3 17.4 17.4 1.6 1.6 12.9 12.9 13.1 13.1 16.5 16.5 1.7 1.7 18.2 18.2 12.9 12.9 16.5 16.5 2.1 2.1 14.5 14.5 16.2 16.2 17.3 17.3 1.7 1.7 18.0 18.0 13.9 13.9 14.5 14.5 1.6 1.6 22.8 22.8 12.2 12.2 16.9 16.9 Investment banking, Broking, AMC, Life Insurance Investment banking, Broking, AMC, Life Insurance Subsidiary overlap Subsidiary overlap Retail brokerage NIL NIL Retail brokerage Source: RBI, JM Financial; Note: CA = Current Account JM Financial Institutional Securities Limited Page 4
27 February 2017 Banking sector Banking sector Exhibit 4. Comparison between banks on a merged basis (Please refer to relevant Annexures for details of ranking) HD HDFCB FCB- -AX AXSB SB Scale Rank Scale Rank (based on Total Assets) 1 1 ICIC ICICIBC IBC- -AX AXSB SB KMB KMB- -AX AXSB SB IIB IIB- -AX AXSB SB YES YES- -AX AXSB SB 1 1 2 2 3 3 2 2 Rural & Semi Urban Urban & Metro Rural penetration of branches 40.9 48.6 47.3 44.7 43.6 51.4 52.7 55.3 56.4 59.1 North West South East & N-East Central 11.8 13.0 14.0 14.4 12.6 22.8 25.3 24.7 28.3 27.8 Regional Branch distribution 14.5 15.4 15.3 14.9 17.3 24.1 22.2 21.3 21.0 26.8 21.0 22.3 22.3 25.0 21.6 14.5 15.9 15.9 14.9 15.8 CA SA Other deposits Liabilities profile 51.2 29.3 54.0 53.8 55.0 29.2 56.2 30.3 30.1 33.9 29.9 38.1 Loan book – Retail vs non-Retail 42.2 Retail Non-Retail 43.8 49.3 50.7 56.2 57.8 61.9 70.1 Term loans / total loans Other loans / total loans 25.6 28.8 30.4 30.1 29.3 Loan book – Term vs. Working capital 69.6 70.7 69.9 71.2 74.4 Efficiency Rank Efficiency Rank Productivity Rank Productivity Rank (GNPA + Restructured (GNPA + Restructured loans) / Total loans loans) / Total loans 5yr Avg. ROA 5yr Avg. ROA 5yr Avg.ROE 5yr Avg.ROE Tier 1 CAR Tier 1 CAR CAR CAR (refer Annex 2) (refer Annex 3) (%) 3 3 1 1 3 3 2 2 3 3 2 2 3 3 5 5 4 4 1 1 3.8 3.8 8.8 8.8 5.9 5.9 6.2 6.2 6.0 6.0 (%, FY12-16) (%, FY12-16) (%, 3QFY17) (%, 3QFY17) 1.8 1.8 18.9 18.9 14.2 14.2 17.0 17.0 1.6 1.6 14.6 14.6 13.0 13.0 16.5 16.5 1.8 1.8 16.9 16.9 14.0 14.0 16.7 16.7 1.7 1.7 18.1 18.1 13.1 13.1 16.0 16.0 1.7 1.7 18.9 18.9 12.7 12.7 16.6 16.6 Investment banking, Broking, AMC, Life Insurance Investment banking, Broking, AMC, Life Insurance Subsidiary overlap Subsidiary overlap Retail brokerage NIL NIL Source: RBI, JM Financial; JM Financial Institutional Securities Limited Page 5
27 February 2017 Banking sector Banking sector Analysing the fit, bank Analysing the fit, bank- -wise wise We have analysed in detail, the post-merger scenario for each bank across several parameters spanning balance sheet and profitability. We have also scored these banks on various matrices to figure the best fit and the possible reasons for an acquisition. We now discuss, bank-wise, why each bank would or would not be a suitable fit and try to deduce who would be the likely aspirants for a merger. HDFCB HDFCB – – More challenges than benef More challenges than benefits ( its ( X X ) ) HDFCB is an unlikely suitor for AXSB since there are minimal benefits of such a merger whereas the challenges are enormous. HDFCB is an unlikely suitor as a HDFCB is an unlikely suitor as a merger would present a great merger would present a great disruption in the existing business disruption in the existing business model with no meaningful long model with no meaningful long term benefit except scale term benefit except scale The benefits are: The merger would create a significantly larger bank with Rs14tn in total assets, Rs8.4tn in loans and Rs10tn in deposits Marginal improvements in efficiency and productivity metrics with revenue/employee and CASA/branch improving marginally Key challenges are:- GNPA and restructured loans for HDFCB were 1.2% of its loans whereas for AXSB they were 7.7% of its loans and 12.8% including SDR, 5-25 refinance, watch-list, etc. as of 3QFY17. HDFCB would be inheriting very concentrated positions in large corporate accounts which are part of consortia lending and will have to devote huge management bandwidth on resolution of these loans. Its asset quality position and provisioning requirement would worsen, capitalization would decline and profitability would decline substantially. HDFCB has traditionally avoided certain types of underwriting, especially in taking concentrated positions in large corporate. Several fee pools are also consciously avoided by HDFCB which deems them risky. It would have to run down these loans and reduce such fee activity after the merger. HDFCB’s parent already has a large asset management company (which isn’t a subsidiary of the bank) and is looking to merge its insurance arm with Max Life where AXSB is a shareholder. This would present additional complications in case of a deal. ICICIBC ICICIBC – – No meaningful gain from acquisition ( No meaningful gain from acquisition ( X X ) ) ICICIBC’s key metrics are largely similar to those of AXSBs. Whether it is branch distribution, liability profile, loan profile, productivity or efficiency, capitalization, etc., both ICICIBC and AXSB compete in similar markets and for similar customer profiles with no large strategic differences in either. Both have a large amount of stressed loan portfolio whereby a combination would not alter risk concentration meaningfully. We believe the probability of this combination is even lower than that for HDFCB. ICICIBC does not stand to gain ICICIBC does not stand to gain anything substantial anything substantial either; would be an unlikely suitor too would be an unlikely suitor too either; hence it hence it , but challenges too ( ( ) ) KMB KMB – – Several synergies Several synergies would would come into play come into play, but challenges too KMB would benefit substantially from a merger with AXSB as it would see meaningful jump in scale, inherit a truly pan-India presence, acquire a large home loan portfolio, SA balances and reduce promoter shareholding which is a key RBI requirement. The flip side would be the acquisition of stressed assets which would alter KMBs impaired loan position and provisioning. The key benefits from a merger would be:- Reduction in promoter shareholding from 33.3% currently to 18.6% after the merger assuming a swap ratio of 3:5 (3shares of KMB for every 5 shares of AXSB). Huge jump in scale where it would become either the largest or second largest private bank in India in balance sheet metrics, branches and cards business. Significant change in liabilities profile with SA ratio increasing c.400bps from the current position. This would allow KMB to drop differential SA rates to 4% JM Financial Institutional Securities Limited Page 6
27 February 2017 Banking sector Banking sector Increased branch presence in rural and semi-urban areas and in North, Central, East and North East India. The combined entity would have among the largest ATM network in India KMB lags AXSB in several productivity metrics like revenue/employee and CASA/employee which would improve. Adoption of best practices would boost productivity Capital utilisation would increase, though not necessarily for quality growth but for provisioning for stressed corporate. KMB has been overcapitalised which has kept its RoE subdued. Increased capital utilisation would increase leverage. The key challenges of the merger would be:- Chances of KMB being an acquirer Chances of KMB being an acquirer are high since there are several are high since there are several obvious gains apart from synergy obvious gains apart from synergy benefits. Will the bank be willing to benefits. Will the bank be willing to digest the stressed loans though? digest the stressed loans though? Acquisition of a large stressed asset portfolio (12.8% of AXSB’s loans as of 3QFY17) and increase in risk concentration Inheritance of loans underwritten differently than how KMB approaches underwriting. KMB might look to let certain types of loans run-off, if they do not gel with KMBs underwriting philosophy. This would be a drag on overall loan growth for 1-2 years after a merger Acquisition of several fee based businesses in debt capital markets, syndication, structured financing, off-balance sheet financing, etc. which KMB is careful about and which it may look to discontinue or wind down Integration of AXSB’s work-force which is several times larger than KMB’s and is trained under a separate philosophy than KMB’s Declining return ratios which may take 2-3 years to rebuild to present levels Complementarities exist, could be a meaningful acquisition ( ( ) ) IIB IIB – – Complementarities exist, could be a meaningful acquisition IIB might consider this acquisition as it would move several years ahead in its growth trajectory and become the second or third largest in various categories. Acquisition of SA balances, home loan portfolio, deeper share of wallet in fees, etc. would be key aspects to consider. On the other hand, increased risk concentration would need to be dealt with and would use up capital, management bandwidth and organizational resources. IIB IIB complementarities complementarities benefit from a merger benefit from a merger. It would be a beneficial acquisition in the long a beneficial acquisition in the long term term also also has has several several would would and and . It would be Benefits from a merger would be:- Large scale with a loan book of Rs4.5tn (third largest), deposits of Rs4.9tn (second largest) and total balance sheet size of Rs7.5tn (third largest) Increased presence in South, East and North-Eastern India in terms of branches and a large, pan-India ATM network. At 4,256 branches, it would have the third largest branch strength after HDFCB and ICICIBC SA proportion would increase from 21% of deposits to 29% post the merger, an increase of c.900bps. High CASA ratio would allow IIB to drop its high SA rates to 4% Acquisition of a large home loan portfolio which IIB does not have currently would make the retail loan portfolio more secured and diversified. IIB would acquire a large market share in debt syndication, structured finance, foreign exchange (both retail and corporate), etc. where it already has meaningful presence. Wider distribution would provide a fillip to third party fees for IIB, increasing the quantum considerably. Productivity of the consolidated entity would improve, best practices can be adopted Challenges after the merger would be:- Concentrated corporate loan portfolio with large proportion of stressed assets, consortium participation and several large accounts which are undergoing resolution would now be transferred on IIBs portfolio. Combined ratio of GNPAs and restructured loans would increase to 6.2% as of 3QFY17 for IIB compared to 1.4% pre-merger. Sharp drop in RoA and RoE immediately after the merger. However, AXSB’s PPOP RoA is still healthy and has not contracted sharply as compared to its own history. From a JM Financial Institutional Securities Limited Page 7
27 February 2017 Banking sector Banking sector medium to long term perspective, IIB would be acquiring a strong revenue generating business The share swap would require a 152% dilution at current market price ould be an impediment ( ( ) ) YES YES – – Big all Big all- -round gains, promoter dilution round gains, promoter dilution w would be an impediment YES stands to gain on multiple fronts from a merger. It would be able to scale up and diversify its liabilities, branch network and loans, all of which it is looking to build organically. However, promoter shareholding would get diluted from 21.8% currently to 7.4% if we consider a share swap at current market prices. From a long term point of view, acquisition of a large franchise would increase granularity in both assets and liabilities and provide a pan- India network which YES can subsequently build upon. Capital position would also be augmented from current levels. YES has several gains to make, viz., YES has several gains to make, viz., in liabilities, branches, in liabilities, branches, network, retail assets, etc. However, network, retail assets, etc. However, promoter shareholding gets diluted promoter shareholding gets diluted substantially. substantially. ATM ATM Benefits of the merger would be:- A combination of YES and AXSB would be most beneficial to YES from a liabilities stand- point. The SA ratio would increase from 22% to 29% for YES, an increase of c.700bps. It would acquire a large amount of granular deposits from mass market customers and could also consider dropping differential SA interest rates YES’s network of 952 branches has higher concentration in Western and Northern India. Addition of AXSB’s network would increase branch distribution in the South, East and North-East part of the country YES has just begun building retail assets organically and these form c.9% of total loans as of 3QFY17. A combined entity would have retail loans at 30% of total loans. YES would be able to integrate and build upon AXSB’s existing customer base and retail infrastructure, intensify cross sell and expand its retail market presence. Inorganic growth would save YES years of effort in building a sizeable retail market share Granularity in fee income profile – Higher mix of retail banking fees in AXSB (c.45%) would complement the lower proportion (20-25%) in YES. YES already has a meaningful presence in debt capital market, syndication, forex, LC/BG, etc. AXSB’s acquisition would expand its size and scale meaningfully and help it deepen and widen its share of wallet with corporate customers. Capital position of the combined entity would be augmented. CET 1 position would increase Key challenges would be:- The promoter shareholding would decline to 7.4% after the merger (assuming swap ratio of 0.4 shares of YES for each share of AXSB), the dilution required for the share swap at current market prices would be 199% Acquisition of stressed asset position as discussed above YES has always underwritten loans with several structures in place such that the loans are taken out in case of exigencies. It usually does not provide a plain vanilla term loan. Acquisition of a large term loan portfolio would require management to consolidate the same, which would be a drag on growth in the near term. JM Financial Institutional Securities Limited Page 8
27 February 2017 Banking sector Banking sector Acquisition of Acquisition of / merger with / merger with AXSB AXSB – – A Quantum Leap A Quantum Leap for all for all The bank that acquires AXSB would rank among the top 3 banks in the country by loans, deposits, balance sheet, branches, ATM network and number of credit and debit cards and POS terminals. This would be a quantum shift in the competitive landscape and a chance for the acquirer to work upon several synergistic and scale benefits in the longer run. Significant complementarities in terms of branch network, product offerings and customers segments offer opportunities for accelerated growth in future. Leapfrogging 6 Leapfrogging 6- -7 years into the future 7 years into the future The post-acquisition market share in advances would increase to 6.3% for KMB, 5.6% for IIB and 5.8% for YES as of 3QFY17. The deposits market share would increase to 4.8% for KMB, 4.5% for IIB and 4.6% for YES. Market share in branches would increase for these branches to 3.3%, 3.1% and 3% respectively as well. Had these banks grown at 20-25% CAGR, they would have achieved the same level of advances and deposits after 6-7 years. Effectively, these banks would leapfrog 6-7 years into the future on an average. Number of years required to reach post merger scale at various rates of growth Number of years required to reach post merger scale at various rates of growth Exhibit 1. Exhibit 1. Loan book (3QFY17, Rs mn) Loan book (3QFY17, Rs mn) (Years) (Years) Pre Pre- -merger merger Post Post- -merger merger KMB 1,578 Loan CAGRs Loan CAGRs (%) 20% 20% 6.4 (%) 25% 25% 15% 15% 30% 30% 5,050 8.3 5.2 4.4 IIB 1,028 4,499 10.6 8.1 6.6 5.6 YES 1,171 4,643 9.9 7.6 6.2 5.3 Source: Company, JM Financial Total advances for top 6 private banks Total advances for top 6 private banks Exhibit 2. Exhibit 2. Advances market share Advances market share Exhibit 3. Exhibit 3. 7.0% 6,000 Total advances market share Total advances market share - - 3Q17 3Q17 Advances Advances - - 3Q17 (Rs. bn) 3Q17 (Rs. bn) 6.2% 4,987 5.7% 6.0% 5,000 4,575 5.0% 4.3% 4,000 3,472 4.0% 3,000 3.0% 2.0% 2,000 1,578 2.0% 1.5% 1.3% 1,171 1,028 1.0% 1,000 0.0% 0 HDFCB ICICIBC AXSB KMB IIB YES HDFCB ICICIBC AXSB KMB IIB YES Source: Company, JM Financial Source: Company, JM Financial Total deposits for top 6 private banks Total deposits for top 6 private banks Exhibit 4. Exhibit 4. Deposit market shares Deposit market shares Exhibit 5. Exhibit 5. Market Share in Total Deposits Market Share in Total Deposits - - 3Q17 3Q17 7,000 Total deposits Total deposits - - 3Q17 3Q17 7.0% 6,347 5.8% 6,000 6.0% 4,653 5,000 5.0% 4.2% 3,708 4,000 4.0% 3.4% 3,000 3.0% 2,000 2.0% 1,494 1,324 1.4% 1,192 1.2% 1.1% 1,000 1.0% 0 0.0% HDFCB ICICIBC AXSB KMB IIB YES HDFCB ICICIBC AXSB KMB IIB YES Source: Company, JM Financial Source: Company, JM Financial JM Financial Institutional Securities Limited Page 9
27 February 2017 Banking sector Banking sector Number of employees Number of employees Exhibit 6. Exhibit 6. 1,00,000 Number of branches Number of branches Exhibit 7. Exhibit 7. 4604 5000 Employees as on FY16 Employees as on FY16 4469 87,555 Branch Network Branch Network - - 2Q17 2Q17 4000 74,096 80,000 3194 3000 60,000 50,135 2000 40,000 31,039 1420 23,060 1062 952 1000 15,000 20,000 0 - HDFCB ICICIBC AXSB KMB IIB YES HDFCB ICICIBC AXSB KMB IIB YES Source: Company, JM Financial Source: Company, JM Financial ATM Market ATM Market share Exhibit 8. Exhibit 8. share Market Share Market Share - - ATMs (2Q17) ATMs (2Q17) 8% 7.0% 6.6% 7% 5.9% 6% 5% 4% 3% 2% 1.0% 0.9% 0.9% 1% 0% HDFCB ICICIBC AXSB KMB IIB YES Source: Company, JM Financial IIB, KMB and YES are trying to bridge the gap with their larger peers in cards, POS terminals and mobile banking. This would be a big attraction since this would catapult the acquirer into a systemically important scale in the payments and merchant transaction space. Building such an infrastructure organically would require significant investments over a long period of time. Banks would also have to outpace their larger peers who would have better scale economies and an early mover advantage in this business. An acquisition-led increase in the volume and value of payments and mobile transactions would be revenue accretive, improve customer retention and expand cross-sell opportunities meaningfully. JM Financial Institutional Securities Limited Page 10
27 February 2017 Banking sector Banking sector Debit cards Debit cards Debit cards market share (%) Debit cards market share (%) Exhibit 10. Exhibit 10. 6% Exhibit 9. Exhibit 9. 40,000 35,353 Debit Cards Debit Cards - - 2Q17 ( 2Q17 ( in '000) in '000) Market Share 2Q17 Market Share 2Q17 - - Debit Cards Debit Cards 35,000 4.8% 5% 30,000 24,202 4% 25,000 3.3% 20,000 3% 17,243 2.3% 15,000 2% 10,000 4,164 1% 0.6% 3,018 5,000 0.4% 1,344 0.2% - 0% HDFCB ICICIBC AXSB KMB IIB YES HDFCB ICICIBC AXSB KMB IIB YES Source: Company, JM Financial Source: Company, JM Financial Credit cards Credit cards Credit cards market share Credit cards market share Exhibit 12. Exhibit 12. 35% Exhibit 11. Exhibit 11. 9,000 8,301 Credit cards Credit cards - - 2Q17 ( in '000) 2Q17 ( in '000) Market Share 2Q17 Market Share 2Q17 - - Credit Cards Credit Cards 30.4% 8,000 30% 7,000 25% 6,000 20% 5,000 4,062 14.9% 4,000 15% 2,887 10.6% 3,000 10% 2,000 890 3.3% 5% 505 1,000 1.8% 29 0.1% - 0% HDFCB ICICIBC AXSB KMB IIB YES HDFCB ICICIBC AXSB KMB IIB YES Source: Company, JM Financial Source: Company, JM Financial Mobile banking transactions by Mobile banking transactions by Value Exhibit 13. Exhibit 13. Mobile banking FY16 (Oct '16) Mobile banking FY16 (Oct '16) - - (Rs billions) Market share in Market share in mobile transactions by value mobile transactions by value Exhibit 14. Exhibit 14. Mobile banking market share by Value for FY16 (Oct Mobile banking market share by Value for FY16 (Oct Value (Rs billions) 20% 220 203.9 '16) '16) 18.0% 200 18% 180 16% 153.5 13.5% 160 14% 140 12% 120 10% 88.1 7.8% 100 8% 80 6% 60 40.8 3.6% 4% 40 15.4 1.4% 2% 20 4.9 0.4% 0 0% HDFCB ICICIBC AXSB KMB IIB YES HDFCB ICICIBC AXSB KMB IIB YES Source: Company, JM Financial Source: Company, JM Financial Significant Significant c complementarities in omplementarities in branch branch network, products and network, products and loans loans AXSB acquisition would provide a large delta in the branch penetration and pan-India distribution of points of presence for most of the mid-sized banks. AXSB’s branches are well- spread out across regions with slightly higher presence in the Eastern Region where HDFBC or ICICIBC have relatively lower branch distribution. With an acquisition, regional branch distribution would become significantly more even for the three mid-sized banks in question. Each bank would expand their absolute pan-India footprint at one go. JM Financial Institutional Securities Limited Page 11
27 February 2017 Banking sector Banking sector While KMB has only 14.4% of its branches in Central, Eastern and North eastern region together, AXSB has 31.6% of its branches in these regions as of 2QFY17. The combined entity will own the largest network of branches in Andhra Pradesh, Gujarat, Karnataka, Maharashtra, Telangana and West Bengal. It would also have the second largest branch network in Rajasthan, Punjab, Tamil Nadu and Uttar Pradesh. Also, combined entity will own highest number of branches by any private bank in Metropolitan and Urban areas. While its metro presence will get a boost, its lagging network in rural and semi-urban areas will be scaled up immediately. Bank Bank- -wise branch distribution across regions in India for large PVBs wise branch distribution across regions in India for large PVBs Exhibit 15. Exhibit 15. KMB- AXSB Branch mix (%) Branch mix (%) HDFCB ICICIBC AXSB KMB IIB YES IIB-AXSB YES-AXSB Central Region Central Region 14.6% 14.6% 12.2% 12.2% 13.2% 13.2% 8.7% 8.7% 18.0% 18.0% 12.3% 12.3% 11.8% 11.8% 14.4% 14.4% 13.0% 13.0% Uttar Pradesh 0.7% 0.7% 1.0% 0.6% 0.5% 1.1% 0.9% 0.9% 1.0% Madhya Pradesh 2.9% 4.7% 3.9% 2.5% 5.9% 5.1% 3.5% 4.4% 4.2% Chhattisgarh 1.7% 1.3% 1.9% 1.1% 3.0% 0.4% 1.6% 2.2% 1.5% Uttarakhand 9.4% 5.5% 6.4% 4.6% 8.6% 5.7% 5.9% 6.9% 6.2% Eastern Region Eastern Region 10.3% 10.3% 11.0% 11.0% 15.6% 15.6% 5.3% 5.3% 11.1% 11.1% 3.7% 3.7% 12.4% 12.4% 14.5% 14.5% 12.8% 12.8% West Bengal 4.0% 4.9% 7.0% 2.7% 4.2% 2.2% 5.7% 6.3% 5.9% Odisha 2.9% 2.9% 4.3% 1.1% 3.0% 0.4% 3.3% 4.0% 3.4% Bihar 2.0% 1.8% 2.5% 0.8% 1.9% 0.3% 2.0% 2.3% 2.0% Jharkhand 1.3% 1.2% 1.5% 0.5% 1.8% 0.5% 1.2% 1.6% 1.3% Others 0.2% 0.2% 0.3% 0.1% 0.2% 0.2% 0.2% 0.3% 0.3% North Eastern Region North Eastern Region 2.2% 2.2% 2.3% 2.3% 2.8% 2.8% 0.4% 0.4% 3.2% 3.2% 1.6% 1.6% 2.1% 2.1% 2.9% 2.9% 2.5% 2.5% Assam 1.2% 1.4% 1.6% 0.3% 2.3% 0.9% 1.2% 1.8% 1.4% Others 1.0% 0.9% 1.2% 0.1% 0.9% 0.6% 0.9% 1.1% 1.1% Northern Region Northern Region 30.2% 30.2% 25.1% 25.1% 24.3% 24.3% 19.6% 19.6% 28.4% 28.4% 42.0% 42.0% 22.8% 22.8% 25.3% 25.3% 28.3% 28.3% Delhi 5.9% 3.8% 4.2% 7.1% 3.9% 9.0% 5.1% 4.1% 5.3% Punjab 10.0% 5.3% 9.0% 4.7% 7.8% 9.0% 7.7% 8.7% 9.0% Rajasthan 3.7% 9.6% 3.7% 3.8% 7.1% 9.3% 3.7% 4.6% 5.0% Haryana 7.1% 4.3% 5.8% 3.2% 7.7% 12.1% 5.0% 6.3% 7.2% Others 3.5% 2.0% 1.6% 0.8% 2.0% 2.5% 1.3% 1.7% 1.8% Southern Region Southern Region 21.7% 21.7% 26.2% 26.2% 23.2% 23.2% 35.0% 35.0% 16.9% 16.9% 13.9% 13.9% 26.8% 26.8% 21.6% 21.6% 21.0% 21.0% Karnataka 5.5% 5.9% 6.0% 12.1% 3.1% 6.1% 7.9% 5.3% 6.0% Andhra Pradesh 2.8% 2.9% 3.5% 8.1% 2.4% 1.3% 4.9% 3.3% 3.0% Telangana 4.3% 4.0% 3.4% 6.3% 2.8% 1.7% 4.3% 3.3% 3.0% Tamil Nadu & Puducherry 5.3% 9.7% 7.4% 6.0% 5.7% 3.2% 7.0% 7.0% 6.4% Kerala 3.7% 3.7% 2.7% 2.4% 2.7% 1.5% 2.6% 2.7% 2.4% Western Region Western Region 21.0% 21.0% 23.1% 23.1% 21.0% 21.0% 30.9% 30.9% 22.3% 22.3% 26.6% 26.6% 24.1% 24.1% 21.3% 21.3% 22.3% 22.3% Maharashtra 11.3% 15.2% 11.6% 21.4% 12.8% 17.9% 14.6% 11.9% 13.0% Gujarat 8.0% 7.1% 9.0% 8.9% 8.4% 7.7% 9.0% 8.8% 8.7% Others 1.6% 0.9% 0.5% 0.6% 1.1% 1.1% 0.5% 0.7% 0.6% Total no of branches Total no of branches 4,604 4,604 4,469 4,469 3,194 3,194 1,420 1,420 1,062 1,062 952 952 4,614 4,614 4,256 4,256 4,146 4,146 Source: Company, JM Financial On the other hand, IIB would gain market presence in the South – an extremely credit intensive market – where it has only 17% of its branches as compared to 20-25% for competitors. Deeper penetration in markets of Karnataka, Andhra Pradesh and Telangana would provide access to key markets with high credit-deposit ratio. While IIB’s branch presence would not be the largest in the meaningful states after such merger, it would JM Financial Institutional Securities Limited Page 12
27 February 2017 Banking sector Banking sector definitely be among the top 2-3. Such a merger would also be in sync with IIBs approach of increasing branch density in key markets. YES would not only witness a sharp jump in branches, which would increase from 952 to 4146, but its distribution is North-centric and would be substantially more diversified with the addition of AXSB’s branches with more branch presence in the East and South. This would also accelerate the build-out of retail assets where it would get a ready platform to build on. We notice that branch market share with private banks other than the top 6 private banks in key South Indian states like Andhra Pradesh, Kerala, Tamil Nadu and Karnataka is high. One- to-one correspondence between credit market share and branch market share cannot be drawn since corporate loans would be booked at the regional or zonal head-quarters. However, for retail loans and retail liabilities, one could draw a broad correlation between the market shares. The large market share with other private banks provides an opportunity for the large private banks. They could easily compete out regional banks given their lower cost of funds, wider product suite, premium service and customer-centricity given a focused approach. State State- -wise split of wise split of branches of Exhibit 16. Exhibit 16. branches of Private Private Banks Banks Total Private Total Private Sector branches Sector branches HDFCB HDFCB ICICIBC ICICIBC AXSB AXSB KMB KMB IIB IIB YES YES Others Others (% of total private sector branches in Key states) (% of total private sector branches in Key states) Andhra Pradesh 15% 15% 13% 14% 3% 1% 38% 843 Gujarat 25% 22% 19% 9% 6% 5% 14% 1,476 Haryana 32% 18% 18% 4% 8% 11% 9% 1,032 Karnataka 14% 14% 10% 9% 2% 3% 47% 1,837 Kerala 8% 8% 4% 2% 1% 1% 76% 2,116 Maharashtra 19% 25% 13% 11% 5% 6% 21% 2,740 Delhi 27% 17% 13% 10% 4% 8% 21% 1,019 Punjab 35% 18% 22% 5% 6% 7% 7% 1,309 Rajasthan 17% 42% 12% 5% 7% 9% 7% 1,010 Tamil Nadu 8% 15% 8% 3% 2% 1% 63% 2,971 Telangana 23% 21% 13% 11% 4% 2% 27% 845 Uttar Pradesh 35% 20% 16% 5% 7% 4% 12% 1,246 West Bengal 16% 19% 19% 3% 4% 2% 37% 1,160 Total Private Bank Total Private Bank branches branches 19% 19% 19% 19% 13% 13% 6% 6% 4% 4% 4% 4% 33% 33% 23,903 23,903 Source: RBI, JM Financial Higher penetration in Rural and semi Higher penetration in Rural and semi- -urban markets: urban markets: The three large private banks, viz., HDFCB, ICICIBC, AXSB, have largely well-distributed branch presence across metro, urban, semi-urban and rural centres. However, the mid-sized banks viz., KMB, IIB and YES are relatively unevenly spread with KMB and IIB having lower percentage of branches in semi-urban centres as compared to YES. Acquisition of AXSB would be most beneficial for rural and semi-urban penetration for KMB and IIB. KMB has been a metro and urban focused bank. AXSB’s presence in rural and semi- urban markets (combined 44%) will increase the combined branch presence to 40% for KMB from 32% of its branches currently. For IIB, the share of branches in rural and semi-urban centres would improve to 43% from 41% currently but the share in semi-urban centres would increase to 26% from 21% currently. This would provide IIB access to more SME and MSME customers going ahead. JM Financial Institutional Securities Limited Page 13
27 February 2017 Banking sector Banking sector Branch distribution across centres Branch distribution across centres Exhibit 17. Exhibit 17. No of Branches No of Branches HDFCB HDFCB ICICI ICICI AXSB AXSB KMB KMB IIB IIB YES YES KMB KMB- -AXSB AXSB IIB IIB- -AXSB AXSB YES YES- -AXSB AXSB Metropolitan 1335 1323 1016 665 351 323 1681 1367 1339 Urban 900 942 757 291 276 195 1048 1033 952 Semi-urban 1446 1343 903 273 223 294 1176 1126 1197 Rural 923 861 518 191 212 140 709 730 658 Total Total 4604 4604 4469 4469 3194 3194 1420 1420 1062 1062 952 952 4614 4614 4256 4256 4146 4146 Mix (% Mix (%) ) Metropolitan 29% 30% 32% 47% 33% 34% 36% 32% 32% Urban 20% 21% 24% 20% 26% 20% 23% 24% 23% Semi-urban 31% 30% 28% 19% 21% 31% 25% 26% 29% Rural 20% 19% 16% 13% 20% 15% 15% 17% 16% Total Total 100% 100% 100% 100% 100% 100% 100% 100% 100% 100% 100% 100% 100% 100% 100% 100% 100% 100% Source: RBI, JM Financial Customer coverage and product offering: Customer coverage and product offering: AXSB had 17mn SA customers as of FY16, which would be added to the customer base of the acquiring bank. AXSB is particularly strong in mass market retail customers and mid- corporates borrowers. This would be complementary to KMB and YES’s expertise in high quality large corporates, HNI and mass affluent segment and SME. Merger will increase th Merger will increase the customer coverage for combined entity e customer coverage for combined entity Exhibit 18. Exhibit 18. AXSB AXSB Mid Corporates SMEs (including Traders) High Net Worth Individuals Mass Affluent Mass Market NRIs MNCs Source: Company, JM Financial. Note: √ Level of Presence KMB KMB IIB IIB YES YES High quality large corporates Complementarities in product offerings will provide significant revenue opportunities for the merged entity. AXSB’s retail business, investment banking business, international exposure (KMB has very low presence internationally) complements strong commercial banking (vehicle finance) business and SME oriented product portfolio of KMB. Acquisition of eING Vysya provided a wider distribution network for KMB’s insurance and asset management subsidiaries. Addition of a much larger network will add additional avenues of distribution and cross-sell. Complementariti Complementarities in product offering es in product offering Exhibit 19. Exhibit 19. AXSB AXSB KMB KMB IIB IIB YES YES Loan Loan Products Products Corporate & Business Banking Commercial Banking (CV,CE etc) Consumer Finance Agriculture/Tractor Liability products Liability products Deposits – CA Deposits – SA Fee based Fee based products products Fees (FX, Trade) Private Banking/ Broking/ IB Asset Management/ Insurance Source: Company, JM Financial. Note: √ Level of Presence JM Financial Institutional Securities Limited Page 14
27 February 2017 Banking sector Banking sector Acquisition of large secured retail portfolio comes with stressed corporate Acquisition of large secured retail portfolio comes with stressed corporate loan book loan book Acquisition of AXSB’s loan portfolio would bring a large, high quality and secured retail loan book but would also have a large proportion of mid and large-corporate loan portfolio (both domestic and international). The retail loan book would be invaluable for YES which has only just begun adding mass in retail assets. This would provide a ready pool of loan assets, retail asset professionals, well-evolved processes, collection infrastructure, etc. On the other hand, IIB would benefit from a large home loan portfolio which it currently lacks. Building a home loan portfolio organically would be very challenging, time consuming and would not add to profitability. Similar benefits would accrue to KMB. While the addition of the retail portfolio would de-risk the balance sheet, the addition of a lumpy corporate portfolio with significantly high stressed loans would add to concentration risks. Especially for KMB and IIB, which have low risk concentration in their respective corporate lending books and have focused on working capital lending. They might run-down such portfolios or sell them to ARCs, which would lower overall loan growth, increase provisions and take up significant management bandwidth in the near to medium term. Loan mix as of 3QFY17 Loan mix as of 3QFY17 – – l large retail portfolio to be Exhibit 20. Exhibit 20. arge retail portfolio to be a key positive a key positive KMB- AXSB IIB- AXSB YES- AXSB Loan Mix as of 3QFY17 (Rs bn) Loan Mix as of 3QFY17 (Rs bn) AXSB KMB IIB YES Agri loans Agri loans 213 213 165 165 NA NA NA NA 378 378 213 213 213 213 Retail Retail 1,286 1,286 847 847 429 429 101 101 2,133 2,133 1,715 1,715 1,387 1,387 Auto loans 150 272 327 NA 422 477 150 Mortgage loans (housing loans + LAP) 837 250 86 NA 1,088 924 837 SBL, PL and CC 179 158 15 NA 337 195 179 Other retail loans 120 0 0 101 120 120 220 SME + Business Banking SME + Business Banking 429 429 166 166 317 317 138 138 429 429 745 745 567 567 Large and Mid Large and Mid- -corporate (Net) corporate (Net) 1,544 1,544 482 482 282 282 932 932 2,026 2,026 1,827 1,827 2,476 2,476 Other 84 0 0 84 0 0 Total (Domestic/International included) Total (Domestic/International included) 3,472 3,472 1,578 1,578 1,028 1,028 1,171 1,171 5,050 5,050 4,499 4,499 4,643 4,643 Loan Mix (%) Loan Mix (%) Agri loans Agri loans 6% 6% 10% 10% 0% 0% 0% 0% 7% 7% 5% 5% 5% 5% Retail Retail 37% 37% 54% 54% 42% 42% 9% 9% 42% 42% 38% 38% 30% 30% Auto loans 4% 17% 32% NA 8% 11% 3% Mortgage loans (housing loans + LAP) 24% 16% 8% NA 22% 21% 18% SBL, PL and CC 5% 10% 1% NA 7% 4% 4% Other retail loans 3% 0% 0% 9% 2% 3% 5% SME SME 12% 12% 11% 11% 31% 31% 12% 12% 8% 8% 17% 17% 12% 12% Large and Mid Large and Mid- -corporate (Net) corporate (Net) 44% 44% 31% 31% 27% 27% 80% 80% 40% 40% 41% 41% 53% 53% Other 0% 5% 0% 0% 2% 0% 0% Total Total (Domestic/International included) (Domestic/International included) 100% 100% 100% 100% 100% 100% 100% 100% 100% 100% 100% 100% 100% 100% Source: Company, JM Financial JM Financial Institutional Securities Limited Page 15
27 February 2017 Banking sector Banking sector Benefits and challenges of a merger with AXSB Benefits and challenges of a merger with AXSB S Synergies ynergies to make combined entity a corporate and retail powerhouse to make combined entity a corporate and retail powerhouse Strong retail franchises of AXSB in both retail loans and deposits would bolster the position of the acquirer bank. The merged entity would look to rationalize branches and employees, widen and deepen their corporate relationships, consolidate stressed asset positions and build upon AXSB’s international lending platform. Both KMB and IIB have a large working capital corporate loan portfolio. The corporate term loan portfolio would change that mix YES already has a large portion of term loans to corporate and a sizeable corporate bond portfolio. Addition of AXSB’s portfolios would increase concentration risks. YES would have to run-down several exposures to reduce such risk. Deeper corporate relationships would allow the acquirer to widen its share of wallet with large and mid-corporates KMB has a large equity capital market and advisory team already. It would have to merge the two teams and rationalise the work-force. Revenue synergies could be derived from mutually exclusive corporate relationships of the two teams. IIB, YES and AXSB have large debt capital market and advisory teams which would present the opportunity for rationalisation. However, IIB and YES do not have significant present in equity capital markets which could be bolstered by the acquisition. With a significantly larger base of liability customers, the acquirer would try to intensify cross-sell of loan and fee-based products to the new customers. Cross-sell of broking, asset management and life and general insurance products would expand. The cross-sell opportunity would be particularly useful for KMB which has its own insurance and asset management subsidiaries. Rationalisation of branches, employees and IT infrastructure would lead to a reduction in the cost/income ratio over time All three banks would benefit from the large international presence of AXSB Revenue per branch Revenue per branch to to improve after the merger improve after the merger Exhibit 21. Exhibit 21. Revenue per branch (ex Revenue per branch (ex- -rural branches) (Rs. Mn) Productivity of the workforce would also improve Productivity of the workforce would also improve Exhibit 22. Exhibit 22. Revenue per employee (Rs. Mn) Revenue per employee (Rs. Mn) - - FY16 FY16 rural branches) (Rs. Mn) - - FY16 FY16 6.0 110 105 104 103 106 5.1 5.2 4.9 100 4.6 5.0 4.5 4.4 4.4 96 100 96 92 4.0 3.4 90 3.1 3.0 78 80 2.0 70 1.0 0.0 60 AXSB IIB KMB YES KMB-AXSB HDFCB YES-AXSB ICICIBC IIB-AXSB IIB AXSB HDFCB KMB KMB-AXSB YES ICICIBC YES-AXSB IIB-AXSB Source: Company, JM Financial Source: Company, JM Financial JM Financial Institutional Securities Limited Page 16
27 February 2017 Banking sector Banking sector Profit per branch would increase Profit per branch would increase Exhibit 23. Exhibit 23. PAT per branch (ex PAT per branch (ex- -rural branches) (Rs. Mn) Profit per employee would increase substantially Profit per employee would increase substantially Exhibit 24. Exhibit 24. Profit per employee (Rs. Mn) Profit per employee (Rs. Mn) - - FY16 rural branches) (Rs. Mn) - - FY16 FY16 FY16 40 2.0 34 34 35 1.7 1.7 32 33 1.6 1.4 28 1.4 28 27 30 1.5 1.3 1.3 1.0 17 20 1.0 0.7 10 0.5 0 0.0 IIB AXSB KMB-AXSB KMB HDFCB YES ICICIBC YES-AXSB IIB-AXSB IIB AXSB KMB-AXSB IIB-AXSB KMB HDFCB YES ICICIBC YES-AXSB Source: Company, JM Financial Source: Company, JM Financial CA CASA SA ratio would improve ratio would improve substantially, should lead to drop in SA rates substantially, should lead to drop in SA rates CASA ratio of AXSB (48% as of 3QFY17) is higher than that of KMB (42%), IIB (37%) and YES (33%). These ratios are overstated by at least 2% as these pertain to post demonetization phase. Some of the SA inflows from 3QFY17 would flow out and move towards investment products or term deposits. A normalized CASA ratio would be 2-3% below 3QFY17 levels. IIB, KMB and AXSB have similar current account (CA) ratios due to their strong corporate franchisee; however, their CA ratios differ. KMB (26% SA ratio), IIB (21%) and YES (22%) offer differential rates on savings deposits while AXSB offers 4% on SA balances. A combination would increase the CASA proportion to 46% for KMB, 45% for IIB and 44% for YES. With some outflows expected, we believe the true CASA ratios would settle 2-3% lower than these proportions. However, that would large put the SA gathering drive in these three banks at ease. Having achieved a critical scale of CASA, the acquirer would moderate its SA rates to 4% as offered by the larger peers today. This would lead to higher margins. CASA ratios would improve substantially CASA ratios would improve substantially Exhibit 25. Exhibit 25. CA % (3Q17) CASA market shares CASA market shares Exhibit 26. Exhibit 26. SA % (3Q17) 8% 7.5% CASA deposits 3Q17 CASA deposits 3Q17 - - Market Share Market Share 60% 50% 7% 45% 45% 46% 44% 50% 48% 42% 6.0% 37% 6% 33% 40% 4.6% 5% 36% 32% 30% 29% 29% 30% 29% 26% 21% 4% 22% 20% 3% 10% 16% 16% 16% 16% 16% 16% 15% 14% 11% 1.6% 2% 0% 1.2% 1.1% IIB AXSB KMB-AXSB KMB YES HDFCB YES-AXSB ICICIBC IIB-AXSB 1% 0% HDFCB ICICIBC AXSB KMB IIB YES Source: Company, JM Financial Source: Company, JM Financial We believe the acquirer would drop their SA rates to 4% post-merger. Differential SA rates were a method to substantially increase the SA proportion, attract high quality deposits and use them for ALM, cross-sell, etc. With augmentation in SA proportions to c.30%, the banks would drop their differential rates as they would have critical mass of SA deposits. Further, maintaining differential rates would have a disproportionate impact on margins since AXSB’s SA ratio is larger than their own SA ratios. For example, should KMB increase the SA rate on the AXSB portfolio, its NIM would drop by 25bps. If it drops the SA rate on its own book, its NIMs would rise by 8bps. JM Financial Institutional Securities Limited Page 17
27 February 2017 Banking sector Banking sector Margin Margin impact from change in SA impact from change in SA rates Exhibit 27. Exhibit 27. rates – – 9MFY17 annualised 9MFY17 annualised (%) (%) (%) (%) Yield Yield on funds on funds (%) (%) Cost Cost of funds of funds (%) (%) NIM (%) NIM (%) AXSB 8.7 5.6 3.5 KMB 9.6 6.0 4.3 IIB 9.9 6.5 4.2 YES 9.6 6.7 3.4 KMB KMB - - AXSB AXSB 9.0 9.0 5.7 5.7 3.7 3.7 - With 5.5% SA interest outgo 6.0 3.5 - With 4.0% SA interest outgo 5.6 3.8 IIB IIB- -AX AXSB SB 9.0 9.0 5.8 5.8 3.6 3.6 - With 5.25% SA interest outgo 6.0 3.4 - With 4.0% SA interest outgo 5.7 3.7 YES YES- -AX AXSB SB 8.9 8.9 5.9 5.9 3.5 3.5 - With 6.25% SA interest outgo 6.3 3.1 - With 4.0% SA interest outgo 5.8 3.6 Source: Company, JM Financial; NIM = Net interest income/average interest earnings assets; Yield on funds= interest income/average interest earning assets, Cost of funds = interest expense/average interest bearing liabilities Cos Cost impact of merger would make it imperative to rationalize rapidly t impact of merger would make it imperative to rationalize rapidly Difference in employee remuneration would have to be resolved after the merger. This would require an increase in salaries of the staff from AXSB. Redundancies in the senior and mid- management level and branch staff would increase. This could lead to an increase in attrition. For instance, KMB’s staff cost per employee at Rs0.9mn is 36% higher than the same for AXSB which is Rs0.67mn. YES, too, has high staff cost per employee of Rs0.86mn. Post a merger, it will be difficult to reduce overall salary levels but it will be imperative to increase the salaries of AXSB to bring parity. This could lead to an increase in staff costs. A simplistic analysis would indicate that to bring the 50,135 employees at AXSB at par, KMB would have an additional staff expense of Rs11.7bn and YES of Rs9.6bn. However, significant difference in pay would probably be due to large retail network and lower paid branch staff at AXSB and the difference in salaries at head offices and zonal offices may not be as large. The final wage bill impact would be much lower, but it would still be meaningful on a combined basis. In IIB’s case, given the large number of branch staff in vehicle finance, the staff expense per employee is lower than that of AXSB. In this case, it would have to perhaps increase salaries of its own staff by Rs3.2bn or lower. A merger would, therefore, have the least impact on IIB from a staff cost point of view. Branch overheads would probably be easier to rationalize as closures or merger of overlapping branches, relocation of branches, etc. would be undertaken over the years following a merger to reduce costs. JM Financial Institutional Securities Limited Page 18
27 February 2017 Banking sector Banking sector Cost Cost/income /income: pre Cost Cost to assets to assets: : pre Exhibit 28. Exhibit 28. 70 : pre- - and post and post- -merger merger (9MFY17) (9MFY17) Exhibit 29. Exhibit 29. 6 pre- - and post and post- -merger merger (9MFY17) (9MFY17) Cost/assets Cost/assets Cost/income Cost/income 61.2 5.0 60 5 48.7 47.3 50 44.0 4 41.9 41.2 41.0 40.4 40.1 3.1 3.0 40 3 2.5 2.3 30 2.1 2.1 2.1 2.0 2 20 1 10 0 0 IIB IIB-AXSB ICICBC AXSB AXSB ICICBC KMB- AXSB IIB AXSB HDFCB (Cons) YES HDFCB YES KMB- (Cons) IIB-AXSB AXSB AXSB YES- YES- KMB KMB Source: Company, JM Financial Source: Company, JM Financial Gap between AXSB, KMB and YES is large Gap between AXSB, KMB and YES is large Exhibit 30. Exhibit 30. Staff costs per employee Staff costs per employee - - FY16 (Rs. Mn) Some cost rationalisation opportunities will arise Some cost rationalisation opportunities will arise Exhibit 31. Exhibit 31. Other opex per branch Other opex per branch- -FY16 (Rs. Mn) FY16 (Rs. Mn) FY16 (Rs. Mn) 30.0 1.0 24.6 0.9 23.7 0.9 0.9 22.8 25.0 21.8 0.8 21.3 22.5 0.8 0.7 18.7 0.7 19.5 0.7 20.0 0.6 17.3 0.7 0.7 0.5 0.6 15.0 0.5 0.4 10.0 0.3 5.0 0.2 0.1 0.0 - ICICIBC HDFCB AXSB IIB IIB-AXSB YES YES-AXSB KMB KMB-AXSB IIB AXSB KMB-AXSB HDFCB KMB YES IIB-AXSB YES-AXSB ICICIBC Source: Company, JM Financial Source: Company, JM Financial Non Non- -interest income would become interest income would become more diversified more diversified AXSB has had among the most diversified fee based businesses as compared to peer banks. Its retail banking fees comprise 40-42% while the rest of the fees comprise of corporate banking (c.25%), business banking, SME and treasury. Strength in retail distribution and cross sell is the key drivers of high retail banking fees. Acquisition of AXSB would provide significant thrust to retail fees at the acquiring bank. Of the three banks under question, the fee/assets ratio of KMB is the lowest at 0.9% as of FY16. KMB consciously avoids fees which require aggression in several products like structured finance, derivatives, M&A, off-balance sheet funding, etc. which the management believes create undue risk. KMB will therefore have to re-evaluate that strategy or shrink the size of such fees at AXSB. Thus, despite the initial thrust in corporate fee, KMB would have to decide on the direction of the ‘riskier’ fee variety. The decision may lead to a moderation in contribution of corporate fee income. The fee income aspect will be much simpler to integrate for IIB or YES which are also aggressive participants in such corporate fee activity. Additionally, the acquisition would diversify fee income substantially for YES where retail fees currently contribute 20-25% of overall fees. In the case of IIB, the contribution of retail fee would already be high. Further, IIB derives a large amount of its fees from off-balance sheet funding, structured products, debt capital markets, advisory, etc. These fee incomes would be similar in AXSB as well. A combination of these departments would allow IIB to widen its customer profile and deepen relationships and share of wallet too. JM Financial Institutional Securities Limited Page 19
27 February 2017 Banking sector Banking sector CEB per branch (ex CEB per branch (ex- -rural Exhibit 32. Exhibit 32. Fee / assets (%) Fee / assets (%) – – F FY16 Exhibit 33. Exhibit 33. rural) ) – – FY16 FY16 Y16 Fee to assets % Fee to assets % CEB income per branch (ex rural) CEB income per branch (ex rural) - - (Rs. Mn) (Rs. Mn) 2.0% 40 34 1.6% 1.6% 29 1.5% 27 27 1.3% 30 1.3% 27 1.2% 1.3% 23 1.1% 21 1.2% 1.0% 21 0.9% 20 14 0.8% 10 0.4% 0.0% 0 IIB AXSB KMB-AXSB KMB YES HDFCB YES-AXSB ICICIBC IIB-AXSB AXSB IIB YES KMB HDFCB KMB-AXSB ICICIBC YES-AXSB IIB-AXSB Source: Company, JM Financial Source: Company, JM Financial Asset quality resolution and recognition Asset quality resolution and recognition The biggest challenge of the merger would perhaps be the import of a concentrated and stressed large corporate portfolio from AXSB. As of 3QFY17, the overall impaired loan portfolio of AXSB was 12.8% of loans while the GNPA and standard restructured loans added up to 7.5%. The remaining pertained to the watch-list, an outstanding amount of Rs127bn as of 3QFY17 and the amounts under SDR, 5-25 refinance, S4A, etc. Further, the non-watchlist slippages have risen to 3% of the 12-month lagged wholesale loans or 1.4% of the 12-month lagged total loans as of 3QFY17. Acquisition of AXSB would require the acquirer to deal with these portfolios. KMB has historically been cautious about under-writing and focused on high quality, low risk exposures. It has also been aggressive about stressed asset recognition and provisioning. Should it acquire AXSB, it would need to not only deal with loans that are already stressed but would also have to decide which loans, especially from the watch-list of AXSB, would need to be declared non-performing based on its own risk framework. This could lead to a jump in GNPAs and correspondingly, an increase in provisions. IIB and YES would also see a marked deterioration in their overall stressed asset positions and YES would have a 9% reduction in its provision coverage ratio. YES had stayed out of consortium lending consciously and would now be saddled with several loans where it would be a consortium leader. IIB has so far kept its focus on retail and SME and has not built large corporate exposures aggressively. It would have to decide a course of action for the large corporate exposures as well. JM Financial Institutional Securities Limited Page 20
27 February 2017 Banking sector Banking sector AXSB AXSB Bank: Movement Bank: Movement of top 10 sectors in the watchlist of top 10 sectors in the watchlist Exhibit 34. Exhibit 34. Sector Sector 4Q16 4Q16 Mix (%) Mix (%) 1Q17 1Q17 Mix (%) Mix (%) 2Q17 2Q17 Mix (%) Mix (%) 3Q17 3Q17 Mix (%) Mix (%) Iron and Steel 54.3 24% 52.8 26% 16.5 12% 16.6 15% Power 52.0 23% 54.8 27% 56.5 41% 54.3 49% Textiles 15.8 7% 14.2 7% na na na na Services 13.6 6% na na na na na na Oil and Gas 13.6 6% 12.2 6% 17.9 13% 6.7 6% Mining 11.3 5% 6.1 3% na na na na Infra & Construction 11.3 5% 12.2 6% 11.0 8% 8.9 8% CRE 9.1 4% 8.1 4% 2.8 2% na na Cement 9.1 4% 6.1 3% 6.9 5% 6.7 6% Shipping 6.8 3% 6.1 3% 4.1 3% 2.2 2% Industrials na na 6.1 3% na na 1.1 1% Other 29.4 13% 30.4 15% 22.1 16% 14.4 13% Total fun based exposure (FB) Total fun based exposure (FB) 226.3 226.3 100% 100% 203.0 203.0 100% 100% 137.9 137.9 100% 100% 110.9 110.9 100% 100% ADD: Non- Fund Based Exposures (NFB) 26.3 25.6 19.0 16.2 Total Exposure (FB+NFB) Total Exposure (FB+NFB) 252.5 252.5 228.6 228.6 156.9 156.9 127.1 127.1 Reduction in Funded Watchlist Reduction in Funded Watchlist na na 10.3% 10.3% 39.0% 39.0% 51.0% 51.0% Reduction in Total Watchlist Reduction in Total Watchlist na na 9.5% 9.5% 38.0% 38.0% 49.7% 49.7% Source: Company, JM Financial AXSB: Increase in non AXSB: Increase in non- -WL slippages Exhibit 35. Exhibit 35. WL slippages 1Q17 1Q17 2Q17 2Q17 3Q17 3Q17 Gross slippages Gross slippages 36,380 36,380 87,720 87,720 45,600 45,600 Of which, Corporate book Corporate book - - Watchlist Watchlist 26,800 26,800 72,880 72,880 25,790 25,790 Corporate book - Outside watchlist 2,310 9,050 11,053 As a % of Total loan book 0.3% 1.2% 1.4% As a % of Wholesale loan book As a % of Wholesale loan book 0.7% 0.7% 2.6% 2.6% 3.0% 3.0% Source: Company, JM Financial Combined Combined asset quality for acquiring bank asset quality for acquiring bank - - (3QFY17) Exhibit 36. Exhibit 36. Provision coverage ratio post acquisition Provision coverage ratio post acquisition - - (3QFY17) Exhibit 37. Exhibit 37. 80% (3QFY17) (3QFY17) GNPA (%) Restructured (%) 10% 70.1% 1.4% 8% 70% 66.0% 1.8% 6% 59.8% 59.5% 59.4% 59.1% 1.5% 58.8% 1.2% 1.4% 60% 56.6% 4% 7.9% 0.1% 5.7% 4.8% 4.7% 4.6% 50% 47.3% 2% 0.1% 0.4% 0.4% 2.4% 1.0% 0.9% 0.9% 0% 40% AXSB IIB KMB HDFCB KMB-AXSB YES ICICIBC YES-AXSB IIB-AXSB ICICIBC HDFCB KMB YES AXSB IIB AXSB AXSB IIB-AXSB KMB- YES- Source: Company, JM Financial Source: Company, JM Financial JM Financial Institutional Securities Limited Page 21
27 February 2017 Banking sector Banking sector LLP LLP (9MFY17 annualised %) (9MFY17 annualised %) Exhibit 38. Exhibit 38. Slippages Slippages for 9MFY17 for 9MFY17 Exhibit 39. Exhibit 39. 9.0% 6.0% 7.2% 7.2% 7.5% 4.7% 6.0% 5.9% 4.5% 6.0% 3.8% 5.3% 4.5% 3.0% 2.3% 2.2% 2.1% 3.0% 1.3% 1.5% 1.1% 0.9% 1.5% 0.6% 0.6% 0.5% 0.4% 0.0% 0.0% YES KMB ICICIBC YES-AXSB IIB AXSB AXSB IIB-AXSB KMB- HDFCB YES ICICIBC KMB IIB AXSB AXSB AXSB AXSB KMB- YES- IIB- Source: Company, JM Financial; Slippages for KMB are for the consolidated entity Source: Company, JM Financial Note: LLP for KMB is for the consolidated entity. Overall impaired loans Overall impaired loans as of 3QFY17 Exhibit 40. Exhibit 40. Trend in Trend in Non Annualised Slippage as a % of Non retail/agri Loan book Annualised Slippage as a % of Non retail/agri Loan book as of 3QFY17 Exhibit 41. Exhibit 41. Non- -watch watch- -list list slippages slippages GNPA (%) Restructured (%) Other impaired (%) 15% 4.0% 12.8% 1Q17 2Q17 3Q17 3.5% 12% 3.1% 10.3%10.0% 3.1% 9.6% 9.3% 3.0% 2.7% 2.6% 9% 2.4% 2.5% 6% 2.0% 2.5% 1.3% 1.3% 1.5% 3% 1.1% 1.4% 1.3% 1.1% 0.9% 1.0% 0% IIB AXSB KMB-AXSB KMB HDFCB YES ICICIBC IIB-AXSB YES-AXSB 0.5% 0.0% ICICI AXIS SBI Source: Company, JM Financial Source: Company, JM Financial JM Financial Institutional Securities Limited Page 22
27 February 2017 Banking sector Banking sector Profitability impact, dilution in key metrics Profitability impact, dilution in key metrics The impact on profitability simply due to the merger would be severe on all three banks being analysed here. However, we should observe that AXSB’s franchise generates significant core operating profitability as seen from its PPP/average assets (PPoP RoA). Despite a meaningful decline in RoA, AXSB’s PPoP ROA is at par with private peers. As compared to its historical record too, the PPoP RoA has not compressed meaningfully, even while bearing the brunt of interest reversals in 9MFY17. In the medium to long term, an acquirer would have added a balance sheet with sustainably healthy core profitability. Key impact of the merger on various operating parameters would be as follows:- Margins would compress for KMB and IIB as discussed earlier due to the addition of low yielding corporate and home loan portfolio. A drop in SA rates after the merger would add to margins while no change in SA rates of the acquirer would lead to a compression in margins. The probability of a drop in SA rates is high. Staff expenses would be affected since the staff cost per employee is 36% higher for KMB and 28% higher for YES as compared to AXSB. KMB/YES will have to bring parity in the pay structure of both organisations. As discussed earlier, the difference could also be due to the large number of staff at branches and field officers whose pay would be relatively lower. Hence the total impact of merger on salary costs may be lesser than calculated earlier. IIB’s staff expenses per employee are 20% lower than AXSB’s. We believe it will have to increase salary payouts. The absolute impact for IIB would be much lower than for KMB or YES in our view. Provision coverage for the three banks being analysed would be c.60% after a merger. However, incremental loan loss provisions would increase in FY18E/19E for KMB, IIB and YES. We currently estimate credit costs of 45bps each for KMB, 62bps each for IIB and 60bps each for YES for FY18E/19E while our estimate for AXSB is 170bps/130bps respectively. Du Pont (9MFY17) Du Pont (9MFY17) Exhibit 42. Exhibit 42. (% of Avg. assets) (% of Avg. assets) Interest Income Interest Expense NII NII Core Non-interest income Non-interest income Total income Total income Employee cost Other Opex Operating costs PPP PPP Provisions PBT ROA ROA ROE (avg. equity) ROE (avg. equity) Source: Company, JM Financial AXSB AXSB 8.1 4.9 3.2 3.2 1.4 2.1 5.4 5.4 0.7 1.4 2.1 3.2 3.2 2.3 0.9 0.6 0.6 6.1 6.1 KMB KMB (C) (C) 9.0 4.7 4.3 4.3 1.6 3.9 8.2 8.2 1.6 3.4 5.0 3.2 3.2 0.3 2.8 1.9 1.9 13.4 13.4 IIB IIB 9.2 5.3 3.9 3.9 2.2 2.6 6.5 6.5 1.0 2.1 3.1 3.4 3.4 0.6 2.8 1.9 1.9 15.0 15.0 YES YES K KMB 9.0 5.8 3.1 3.1 1.8 2.1 5.2 5.2 1.0 1.2 2.1 3.1 3.1 0.4 2.7 1.8 1.8 21.5 21.5 MB- -AX AXSB SB 8.4 4.8 3.6 3.6 1.5 2.7 6.2 6.2 1.0 2.1 3.0 3.2 3.2 1.7 1.5 1.0 1.0 9.0 9.0 IIB IIB- -AXSB AXSB Y YES ES- -AXSB AXSB 8.3 5.0 3.4 3.4 1.6 2.2 5.6 5.6 0.8 1.6 2.3 3.3 3.3 1.9 1.3 0.9 0.9 8.4 8.4 8.3 5.1 3.2 3.2 1.5 2.1 5.3 5.3 0.8 1.4 2.1 3.2 3.2 1.8 1.3 0.9 0.9 9.4 9.4 Du Pont analysis (FY1 Du Pont analysis (FY18 8) ) Exhibit 43. Exhibit 43. AXSB AXSB 7.8 4.7 3.1 3.1 1.4 1.8 4.8 4.8 0.7 1.4 2.1 2.7 2.7 1.2 1.6 1.0 1.0 11.9 11.9 KMB (C) KMB (C) IIB IIB 8.9 5.1 3.9 3.9 2.4 2.6 6.5 6.5 1.0 2.2 3.1 3.3 3.3 0.5 2.8 1.8 1.8 17.1 17.1 YES YES K KMB 9.1 5.7 3.4 3.4 1.8 2.0 5.4 5.4 0.9 1.2 2.1 3.3 3.3 0.5 2.8 1.8 1.8 23.3 23.3 MB- -AX AXSB 7.9 4.6 3.4 3.4 2.0 2.4 5.8 5.8 0.9 2.0 3.0 2.8 2.8 0.9 1.9 1.3 1.3 12.6 12.6 SB IIB IIB- -AXSB AXSB Y YES ES- -AXSB AXSB Interest Income Interest Expense NII NII Core Non-interest income Non-interest income Total income Total income Employee cost Other Opex Operating costs PPP PPP Provisions PBT ROA ROA ROE (avg. equity) ROE (avg. equity) Source: Company, JM Financial 8.2 4.2 4.0 4.0 3.3 3.9 7.9 7.9 1.5 3.3 4.9 3.0 3.0 0.3 2.7 1.8 1.8 13.6 13.6 8.1 4.8 3.3 3.3 1.6 1.9 5.2 5.2 0.8 1.6 2.3 2.9 2.9 1.0 1.8 1.2 1.2 13.3 13.3 8.1 5.0 3.2 3.2 1.5 1.8 5.0 5.0 0.7 1.4 2.1 2.9 2.9 1.0 1.9 1.2 1.2 14.6 14.6 JM Financial Institutional Securities Limited Page 23
27 February 2017 Banking sector Banking sector Steep dilution in promoter shareholding would be a disincentive to merge Steep dilution in promoter shareholding would be a disincentive to merge At current market prices, each of the banks being analysed would have to dilute their existing shareholders tremendously to acquire AXSB. However, dilution would be the most for YES at 199%, for IIB it would be 152% and for KMB it would be 81% (assuming no premium to current market capitalization). Acquisition of AXSB would be most beneficial to KMB. KMB’s promoter shareholding would be diluted from 33.3% currently to 18.6% post-merger (assuming a swap ratio of 0.6 shares of KMB for every share of AXSB). As per RBI directive, KMB needs to reduce its promoter shareholding to less than 30% by 30 June 2017, to less than 20% by 31 December 2018 and less than 15% by 31 March 2020. The merger would provide KMB three years to comply with the 2020 deadline while making it compliant with the first two. For IIB as well, the promoter shareholding would decline from 15% as of 3QFY17 to 6.1% after the merger. The dilution required would be much higher as compared to that for KMB at 152%. Shareholding of Shareholding of KMB Exhibit 44. Exhibit 44. KMB and combined shareholding and combined shareholding Axis Axis Kotak Kotak KMB KMB- -AXSB AXSB Other, Other, 11.6% 11.6% Other, Other, 10.5% 10.5% Uday Uday Kotak, Kotak, 18.6% 18.6% Other, 9.6% Other, 9.6% LIC, 14.5% LIC, 14.5% ING ING DII, 8.5% DII, 8.5% DII, DII, 10.1% 10.1% Uday Kotak, Uday Kotak, 33.3% 33.3% DII, 12.2% DII, 12.2% Mauritius Mauritius , 2.2% , 2.2% SUUTI, SUUTI, 12.0% 12.0% LIC, LIC, 6.4% 6.4% SUUTI, SUUTI, 5.3% 5.3% ING ING Mauritius, Mauritius, 3.9% 3.9% FII, 44.8% FII, 44.8% FII, FII, FII, 49.7% FII, 49.7% 46.9% 46.9% Source: JM Financial Change in IIB’s shareholding after a Change in IIB’s shareholding after a merger with AXSB Exhibit 45. Exhibit 45. merger with AXSB IIB IIB- -AXSB AXSB IIB IIB DII, DII, 16.9% 16.9% DII, DII, 23.6% 23.6% Other, Other, 6.5% 6.5% Other, Other, 9.5% 9.5% Promoter Promoter s, 15.0% s, 15.0% Promoter Promoter s, 6.1% s, 6.1% LIC, LIC, 8.6% 8.6% SUUTI, SUUTI, 7.1% 7.1% FII, FII, 51.8% 51.8% FII, FII, 54.9% 54.9% Source: Company, JM Financial Change in YES’ shareholding after a merger with AXSB Change in YES’ shareholding after a merger with AXSB Exhibit 46. Exhibit 46. YES YES- -AXSB AXSB YES Bank YES Bank DII, DII, 17.1% 17.1% DII, DII, 26.4% 26.4% Other, Other, 9.3% 9.3% Other, Other, 10.8% 10.8% Promoter Promoter s, 7.4% s, 7.4% Promoter Promoter s, 21.8% s, 21.8% LIC, LIC, 9.6% 9.6% FII, FII, 47.2% 47.2% SUUTI, SUUTI, 7.9% 7.9% FII, FII, 42.5% 42.5% Source: Company, JM Financial JM Financial Institutional Securities Limited Page 24
27 February 2017 Banking sector Banking sector The dilution, however, would be the most for YES as mentioned above. Promoter shareholding in this case would dwindle to 7.4% after the merger as compared to 21.8% currently. Given there are two large promoters in YES with similar shareholding, each would own roughly half the shares. This, we believe, is a major disincentive for YES to acquire AXSB. Share swap ratio Share swap ratio and dilution in case of the merger and dilution in case of the merger Exhibit 47. Exhibit 47. KMB KMB IIB IIB Y YES ES Outstanding Shares of acquirer bank (mn) 1,841 597 423 Share price (Rs/share) 801 1,319 1,422 Market Capitalisation (Rs mn) 14,74,641 7,88,002 6,01,475 O/s Shares of AXSB Bank (mn) 2349 2349 2349 Share price of AXSB Bank (Rs/share) 509 509 509 Market cap of AXSB Bank (Rs mn) 11,95,641 11,95,641 11,95,641 Premium to market cap of AXSB (%) 0% 0% 0% Shares to be received by Shares to be received by AXSB AXSB shareholders shareholders (mn) (mn) 1,492.7 1,492.7 906.5 906.5 840.8 840.8 S Swap ratio wap ratio (No. of shares received for each share of AXSB) (x) (No. of shares received for each share of AXSB) (x) 0.6 0.6 0.4 0.4 0. 0.4 4 Dilution (%) Dilution (%) 81 81 1 152 52 19 199 9 Source: Company, JM Financial Valuation (Pre and post merger) at CMP Valuation (Pre and post merger) at CMP Exhibit 48. Exhibit 48. KMB KMB- - AXSB AXSB IIB IIB- - YES YES- - AXSB AXSB AXSB AXSB KMB (Cons) KMB (Cons) IIB IIB YES YES AXSB AXSB EPS - 9MFY17 13.9 25.6 47.2 76.2 24.0 40.5 51.4 EPS - FY18E 29.6 30.1 60.9 100.1 37.5 70.4 88.5 BVPS - FY18E 261.9 236.3 382.4 469.0 315.0 560.9 643.7 Current Market Price 509.0 801.0 1,319.0 1,422.0 801.0 1,319.0 1,422.0 Market Capitalisation (Rs bn) 1,195.6 1,474.6 788.0 601.5 2,670.3 1,983.6 1,797.1 P/E (FY18E) P/E (FY18E) 17.2 17.2 26.6 26.6 21.7 21.7 14.2 14.2 21.4 21.4 18.7 18.7 16.1 16.1 P/BVPS (FY18E) P/BVPS (FY18E) 1.9 1.9 3.4 3.4 3.4 3.4 3.0 3.0 2.5 2.5 2.4 2.4 2.2 2.2 Source: Company, JM Financial JM Financial Institutional Securities Limited Page 25
27 February 2017 Banking sector Banking sector Annexures Annexures Annexure 1. Ranking for Scale Annexure 1. Ranking for Scale 3Q17 (Rs. Bn) 3Q17 (Rs. Bn) Relative Relative position in the industry today position in the industry today Rank as compared with remaining banks Rank as compared with remaining banks HDFCB- AXSB ICICIBC- AXSB HDFCB ICICIBC AXSB KMB IIB YES KMB-AXSB IIB-AXSB YES-AXSB Total Assets 8,280 7,578 5,788 2,018 1,671 1,948 14,068 13,366 7,805 7,459 7,736 - Rank 1 2 3 4 6 5 1 1 2 3 2 Loans 4,950 4,575 3,472 1,578 1,028 1,171 8,422 8,046 5,050 4,499 4,643 - Rank 1 2 3 4 6 5 1 1 1 3 2 Deposits 6,347 4,653 3,708 1,494 1,192 1,324 10,055 8,361 5,201 4,900 5,032 - Rank 1 2 3 4 6 5 1 1 2 2 3 Source: Company, JM Financial How to read the table How to read the table: : The banks are ranked on total assets, loans and deposits individually. Then we compare each of the merged entities with the remaining banks. The rank denotes the relative position for each merged entity as compared to the remaining banks. For example, IIB-AXSB would be ranked 3 ranked 2 rd in the industry by total assets and loans but would be nd in the industry by deposits as compared to ICICIBC, HDFCB, KMB and YES. Annexure 2. Ranking and Score for Efficiency Annexure 2. Ranking and Score for Efficiency HDFCB- AXSB ICICIBC- AXSB KMB- AXSB FY16 (Rs. mn) FY16 (Rs. mn) HDFCB ICICIBC AXSB KMB IIB YES IIB-AXSB YES-AXSB Staff cost/ Employee Rank Other Opex/Branch Rank Score Score Composite Rank Composite Rank Source: Company, JM Financial How to read the table How to read the table: : The banks are compared on two efficiency parameters above and are then ranked. For example, IIB with staff cost/employee of Rs0.54mn is ranked one since this is the lowest among peers. HDFCB has higher other operating expense per branch ratio and is hence ranked 6 ranked 1, AXSB and IIB have the same scores and are ranked 2 be the best merger in terms of efficiency, an ICICIBC-AXSB combine would rank the best followed by IIB-AXSB. 0.65 0.68 0.67 0.91 0.54 0.86 0.66 0.67 0.76 0.63 0.72 2 2 2 6 1 5 2 2 5 1 4 24.6 17.3 22.5 18.7 23.7 19.5 23.8 19.4 21.3 22.8 21.8 6 8 8 4 4 1 3 3 1 1 4 6 6 2 2 2 8 8 4 4 5 6 6 2 2 3 8 8 4 4 5 7 7 3 3 1 3 3 1 1 2 7 7 3 3 4 5 5 2 2 3 7 7 3 3 th. The score is a sum of the ranks. ICIICBC has the lowest score and is hence nd. While analysing which will Annexure 3. Ranking and Score for Productivity Annexure 3. Ranking and Score for Productivity HDFCB- AXSB ICICIBC- AXSB KMB- AXSB FY16 FY16 HDFCB ICICIBC AXSB KMB IIB YES IIB-AXSB YES-AXSB Reveneue/Employee (Rs mn) Rank CASA/Employee (Rs '000) Rank CASA/Branch (Rs'000) Rank Score Score Composite Rank Composite Rank Source: Company, JM Financial How to read the table How to read the table: : The banks are compared on three productivity parameters above and then ranked. AXSB with revenue/employee of Rs5.2mn is ranked one since this is the highest among peers. IIB has the lowest CASA/.employee ratio and is hence ranked 6 sum of the ranks. The lowest score is then ranked 1, the next is ranked two and so on. The ‘composite rank’ reveals that AXSB scores the best on productivity parameters while a YES- AXSB combine would be the best in terms of productivity as compared with other mergers. 4.4 4.5 5.2 3.1 3.4 4.9 4.7 4.8 4.4 4.6 5.1 4 3 1 6 5 2 2 2 5 4 1 32.9 31.3 35.2 20.2 19.2 29.4 33.7 32.9 29.5 30.1 33.9 2 3 1 5 6 4 2 3 5 4 1 407.9 371.6 394.6 272.2 245.1 340.5 402.6 380.9 355.3 356.4 382.5 1 7 7 2 2 3 9 9 3 3 2 4 4 1 1 5 6 4 1 5 5 2 2 3 8 8 3 3 5 4 2 4 4 1 1 16 16 5 5 17 17 6 6 10 10 4 4 15 15 5 5 12 12 4 4 th. The score is a JM Financial Institutional Securities Limited Page 26
27 February 2017 Banking sector Banking sector APPENDIX I JM Financial Institutional Securities Limited Corporate Identity Number: U65192MH1995PLC092522 Member of BSE Ltd. and National Stock Exchange of India Ltd. and Metropolitan Stock Exchange of India Ltd. SEBI Registration Nos.: BSE - INZ010012532, NSE - INZ230012536 and MSEI - INZ260012539, Research Analyst – INH000000610 Registered Office: 7th Floor, Cnergy, Appasaheb Marathe Marg, Prabhadevi, Mumbai 400 025, India. Board: +9122 6630 3030 | Fax: +91 22 6630 3488 | Email: jmfinancial.research@jmfl.com | www.jmfl.com Compliance Officer: Mr. Sunny Shah | Tel: +91 22 6630 3383 | Email: sunny.shah@jmfl.com Definition of ratings Rating Buy Hold Sell Meaning Total expected returns of more than 15%. Total expected return includes dividend yields. Price expected to move in the range of 10% downside to 15% upside from the current market price. Price expected to move downwards by more than 10% Research Analyst(s) Certification The Research Analyst(s), with respect to each issuer and its securities covered by them in this research report, certify that: All of the views expressed in this research report accurately reflect his or her or their personal views about all of the issuers and their securities; and No part of his or her or their compensation was, is, or will be directly or indirectly related to the specific recommendations or views expressed in this research report. Important Disclosures This research report has been prepared by JM Financial Institutional Securities Limited (JM Financial Institutional Securities) to provide information about the company(ies) and sector(s), if any, covered in the report and may be distributed by it and/or its associates solely for the purpose of information of the select recipient of this report. This report and/or any part thereof, may not be duplicated in any form and/or reproduced or redistributed without the prior written consent of JM Financial Institutional Securities. This report has been prepared independent of the companies covered herein. JM Financial Institutional Securities is registered with the Securities and Exchange Board of India (SEBI) as a Research Analyst, Merchant Banker and a Stock Broker having trading memberships of the BSE Ltd. (BSE), National Stock Exchange of India Ltd. (NSE) and Metropolitan Stock Exchange of India Ltd. (MSEI). No material disciplinary action has been taken by SEBI against JM Financial Institutional Securities in the past two financial years which may impact the investment decision making of the investor. JM Financial Institutional Securities provides a wide range of investment banking services to a diversified client base of corporates in the domestic and international markets. It also renders stock broking services primarily to institutional investors and provides the research services to its institutional clients/investors. JM Financial Institutional Securities and its associates are part of a multi-service, integrated investment banking, investment management, brokerage and financing group. JM Financial Institutional Securities and/or its associates might have provided or may provide services in respect of managing offerings of securities, corporate finance, investment banking, mergers & acquisitions, broking, financing or any other advisory services to the company(ies) covered herein. JM Financial Institutional Securities and/or its associates might have received during the past twelve months or may receive compensation from the company(ies) mentioned in this report for rendering any of the above services. JM Financial Institutional Securities and/or its associates, their directors and employees may; (a) from time to time, have a long or short position in, and buy or sell the securities of the company(ies) mentioned herein or (b) be engaged in any other transaction involving such securities and earn brokerage or other compensation or act as a market maker in the financial instruments of the company(ies) covered under this report or (c) act as an advisor or lender/borrower to, or may have any financial interest in, such company(ies) or (d) considering the nature of business/activities that JM Financial Institutional Securities is engaged in, it may have potential conflict of interest at the time of publication of this report on the subject company(ies). Neither JM Financial Institutional Securities nor its associates or the Research Analyst(s) named in this report or his/her relatives individually own one per cent or more securities of the company(ies) covered under this report, at the relevant date as specified in the SEBI (Research Analysts) Regulations, 2014. The Research Analyst(s) principally responsible for the preparation of this research report and members of their household are prohibited from buying or selling debt or equity securities, including but not limited to any option, right, warrant, future, long or short position issued by company(ies) covered under this report. The Research Analyst(s) principally responsible for the preparation of this research report or their relatives (as defined under SEBI (Research Analysts) Regulations, 2014); (a) do not have any financial interest in the company(ies) covered under this report or (b) did not receive any compensation from the company(ies) covered under this report, or from any third party, in connection with this report or (c) do not have any other material conflict of interest at the time of publication of this report. Research Analyst(s) are not serving as an officer, director or employee of the company(ies) covered under this report. While reasonable care has been taken in the preparation of this report, it does not purport to be a complete description of the securities, markets or developments referred to herein, and JM Financial Institutional Securities does not warrant its accuracy or completeness. JM Financial Institutional Securities may not be in any way responsible for any loss or damage that may arise to any person from any inadvertent error in the information contained in this report. This report is provided for information only and is not an investment advice and must not alone be taken as the basis for an investment decision. The investment discussed or views expressed or recommendations/opinions given JM Financial Institutional Securities Limited Page 27
27 February 2017 Banking sector Banking sector herein may not be suitable for all investors. The user assumes the entire risk of any use made of this information. The information contained herein may be changed without notice and JM Financial Institutional Securities reserves the right to make modifications and alterations to this statement as they may deem fit from time to time. This report is neither an offer nor solicitation of an offer to buy and/or sell any securities mentioned herein and/or not an official confirmation of any transaction. This report is not directed or intended for distribution to, or use by any person or entity who is a citizen or resident of or located in any locality, state, country or other jurisdiction, where such distribution, publication, availability or use would be contrary to law, regulation or which would subject JM Financial Institutional Securities and/or its affiliated company(ies) to any registration or licensing requirement within such jurisdiction. The securities described herein may or may not be eligible for sale in all jurisdictions or to a certain category of investors. Persons in whose possession this report may come, are required to inform themselves of and to observe such restrictions. Persons who receive this report from JM Financial Singapore Pte Ltd may contact Mr. Ruchir Jhunjhunwala (ruchir.jhunjhunwala@jmfl.com) on +65 6422 1888 in respect of any matters arising from, or in connection with, this report. Additional disclosure only for U.S. persons: JM Financial Institutional Securities has entered into an agreement with JM Financial Securities, Inc. ("JM Financial Securities"), a U.S. registered broker-dealer and member of the Financial Industry Regulatory Authority ("FINRA") in order to conduct certain business in the United States in reliance on the exemption from U.S. broker-dealer registration provided by Rule 15a-6, promulgated under the U.S. Securities Exchange Act of 1934 (the "Exchange Act"), as amended, and as interpreted by the staff of the U.S. Securities and Exchange Commission ("SEC") (together "Rule 15a-6"). This research report is distributed in the United States by JM Financial Securities in compliance with Rule 15a-6, and as a "third party research report" for purposes of FINRA Rule 2241. In compliance with Rule 15a-6(a)(3) this research report is distributed only to "major U.S. institutional investors" as defined in Rule 15a-6 and is not intended for use by any person or entity that is not a major U.S. institutional investor. If you have received a copy of this research report and are not a major U.S. institutional investor, you are instructed not to read, rely on, or reproduce the contents hereof, and to destroy this research or return it to JM Financial Institutional Securities or to JM Financial Securities. This research report is a product of JM Financial Institutional Securities, which is the employer of the research analyst(s) solely responsible for its content. The research analyst(s) preparing this research report is/are resident outside the United States and are not associated persons or employees of any U.S. registered broker-dealer. Therefore, the analyst(s) are not subject to supervision by a U.S. broker-dealer, or otherwise required to satisfy the regulatory licensing requirements of FINRA and may not be subject to the Rule 2241 restrictions on communications with a subject company, public appearances and trading securities held by a research analyst account. JM Financial Institutional Securities only accepts orders from major U.S. institutional investors. Pursuant to its agreement with JM Financial Institutional Securities, JM Financial Securities effects the transactions for major U.S. institutional investors. Major U.S. institutional investors may place orders with JM Financial Institutional Securities directly, or through JM Financial Securities, in the securities discussed in this research report. Additional disclosure only for U.K. persons: Neither JM Financial Institutional Securities nor any of its affiliates is authorised in the United Kingdom (U.K.) by the Financial Conduct Authority. As a result, this report is for distribution only to persons who (i) have professional experience in matters relating to investments falling within Article 19(5) of the Financial Services and Markets Act 2000 (Financial Promotion) Order 2005 (as amended, the "Financial Promotion Order"), (ii) are persons falling within Article 49(2)(a) to (d) ("high net worth companies, unincorporated associations etc.") of the Financial Promotion Order, (iii) are outside the United Kingdom, or (iv) are persons to whom an invitation or inducement to engage in investment activity (within the meaning of section 21 of the Financial Services and Markets Act 2000) in connection with the matters to which this report relates may otherwise lawfully be communicated or caused to be communicated (all such persons together being referred to as "relevant persons"). This report is directed only at relevant persons and must not be acted on or relied on by persons who are not relevant persons. Any investment or investment activity to which this report relates is available only to relevant persons and will be engaged in only with relevant persons. Additional disclosure only for Canadian persons: This report is not, and under no circumstances is to be construed as, an advertisement or a public offering of the securities described herein in Canada or any province or territory thereof. Under no circumstances is this report to be construed as an offer to sell securities or as a solicitation of an offer to buy securities in any jurisdiction of Canada. Any offer or sale of the securities described herein in Canada will be made only under an exemption from the requirements to file a prospectus with the relevant Canadian securities regulators and only by a dealer properly registered under applicable securities laws or, alternatively, pursuant to an exemption from the registration requirement in the relevant province or territory of Canada in which such offer or sale is made. This report is not, and under no circumstances is it to be construed as, a prospectus or an offering memorandum. No securities commission or similar regulatory authority in Canada has reviewed or in any way passed upon these materials, the information contained herein or the merits of the securities described herein and any representation to the contrary is an offence. If you are located in Canada, this report has been made available to you based on your representation that you are an “accredited investor” as such term is defined in National Instrument 45-106 Prospectus Exemptions and a “permitted client” as such term is defined in National Instrument 31-103 Registration Requirements, Exemptions and Ongoing Registrant Obligations. Under no circumstances is the information contained herein to be construed as investment advice in any province or territory of Canada nor should it be construed as being tailored to the needs of the recipient. Canadian recipients are advised that JM Financial Securities, Inc., JM Financial Institutional Securities Limited, their affiliates and authorized agents are not responsible for, nor do they accept, any liability whatsoever for any direct or consequential loss arising from any use of this research report or the information contained herein. JM Financial Institutional Securities Limited Page 28