Hearing Loss Prevention Annual Statistics--2005
210 likes | 394 Vues
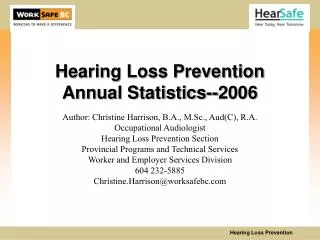
Hearing Loss Prevention Annual Statistics--2005. Author: Christine Harrison, B.A., M.Sc., Aud(C), R.A. Occupational Audiologist Hearing Loss Prevention Section Provincial Programs and Technical Services Industry and Labour Services Department Worker and Employer Services Division

Hearing Loss Prevention Annual Statistics--2005
E N D
Presentation Transcript
Hearing Loss PreventionAnnual Statistics--2005 Author: Christine Harrison, B.A., M.Sc., Aud(C), R.A. Occupational Audiologist Hearing Loss Prevention Section Provincial Programs and Technical Services Industry and Labour Services Department Worker and Employer Services Division 604 232-5885 Christine.Harrison@worksafebc.com
General Statistics 2005 • 141,764 workers tested • 284 active Industrial Audiometric Technicians • 86 in-house programs • 21 mobile contractors • 23 fixed contractors
Summary StatisticsAll Industry • Normal Early Warning Abnormal Total • # % # % # % # • First • Timers 2829 73.6 828 21.6 184 4.8 3832 • Other • Baseline 14505 67.4 5462 25.4 1732 7.2 21520 • N.Change E.W. Change A. Change Total • # % # % # % # • Periodic 102058 87.7 10529 9.0 3825 3.3 116412 • Total tested in B.C. 141,764
Early Warning Change 2005Selected Industries Classification Unit # of Periodics%EWC Logging 4863 10.3 Wood Products Man. 28391 7.7 Heavy Manufacturing 11884 9.0 General Construction 19829 12.2 Heavy Construction 949 11.5 Road Building 2961 9.3 Municipalities 9280 7.4 Public Schools 2648 9.6
Hearing Protection Non-use--1981 vs. 2005 % non-use Type of Industry
No Hearing Protection—by Age % non-use
Hearing Protection Non-use--Age <20 yrs. %non-use Type of Industry
Abnormal Hearing—all workers Age in years
Fallers Average Hearing Loss 1981 vs. 2005 Frequency in kHz
Sawmill Workers Average Hearing Loss 1981 vs. 2005 Frequency in kHz
Truck Drivers Average Hearing Loss 1981 vs. 2005 Frequency in kHz
Welders Average Hearing Loss 1981 vs. 2005 Frequency in kHz
New Noise Induced Hearing Loss Claims Million $ #
Claims Costs (Awards) Year # Total Average (million$) $ per claim 1977 566 2.9 5260 1982 247 1.1 4565 1987 481 3.6 7590 1992 558 3.3 5996 1997 562 3.3 5872 2005 716 1.4 2000* * multiply by .315 to convert to 1977 $s = $ 630.00/ claim