Productivity and Growth
360 likes | 552 Vues
Productivity and Growth. CHAPTER 21. © 2003 South-Western/Thomson Learning. Standard of Living. Economy’s standard of living as measured by the amount of goods and services available per person grows over the long run because of

Productivity and Growth
E N D
Presentation Transcript
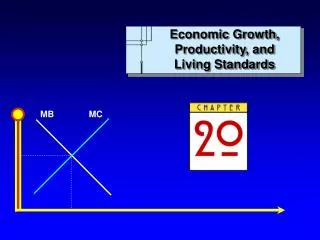
Productivity and Growth CHAPTER 21 © 2003 South-Western/Thomson Learning
Standard of Living • Economy’s standard of living as measured by the amount of goods and services available per person grows over the long run because of • increases in the amount and quality of resources, especially labor and capital • better technology • improvements in the rules of the game that facilitate production and exchange • tax laws • property rights • patent laws • legal system
Growth and the PPF • Recall that the production possibilities frontier – PPF – shows alternative combinations of goods that an economy can produce if available resources are used efficiently • See Exhibit 1 • Quantity of resources in the economy fixed • Level of technology fixed • Rules of the game remain fixed • Two broad categories of goods – consumer goods and capital goods
Exhibit 1: Economic Growth When resources are employed efficiently, CI in each of the panels shows the possible combinations of consumer goods and capital goods that can be produced in a given year Points C and I depict the quantity of consumer and capital goods produced if all resources are used to produce that good, respectively Economic growth is an outward shift of the PPF in each of the two panels
Economic Growth • Causes of economic growth • Increase in the availability of resources • Growth in the labor supply • Population increases • Existing population supplies more labor • Growth in the capital stock • The more capital goods produced this year, the more the economy will grow • Improvement in Technology • Expand the frontier by making more efficient use of existing resources • Improvements in the Rules of the game • Improvements that nurture production and exchange will promote growth
Exhibit 1: Capital Produced and Growth The amount of capital produced this year will affect the location of the PPF next year In the left panel, the economy has chosen point A from the possible combinations which shifts the PPF from CI this year to C'I' next year However, if more capital goods are produced this year, as reflected by point B in the right panel, the PPF will shift outward farther next year to C"I" Thus, an economy that invests more in capital – gives up more consumer goods – will experience larger economic growth
What is Productivity? • Production is a process that transforms resources into products • Productivity • measures how efficiently resources are employed • the higher the productivity, the more goods and services that can be produced from a given amount of resources the farther out will be the PPF • defined as the ratio of total output to a specific measure of input • total output divided by the amount of a particular kind of resource employed
Labor Productivity • Output per unit of labor and measures total output divided by the hours of labor employed to produce that output • Most commonly used resource to measure productivity • Accounts for a relatively large share of the cost of production – 70% on average • More easily measured than other inputs • Can be measured as hours per week or full-time workers per year
Labor Productivity • The resource most responsible for increasing labor productivity is capital • As the economy accumulates more capital per worker, labor productivity increases standard of living increases • Two broad categories of capital • Human Capital • Accumulated knowledge, skill, and experience of the labor force • As individual workers acquire more human capital, their productivity and income increase • Physical Capital • Includes the machines, buildings, roads, airports, communication networks and other manufactured creations used to produce goods and services
PF y 0 Capital per worker k Exhibit 2: Per-Worker Production Function Expresses the relationship between the amount of capital per worker (horizontal axis) and the output per worker (vertical axis), other things constant (level of technology and the rules of the game) Any point on the production function, PF, shows how much output per worker can be produced for a given amount of capital per worker Output per worker When there are k units of capital per worker, average output per worker in the economy is y Upward slope of the curve occurs because an increase in capital per worker helps each worker produce more output
Per Worker Production Function • The shape of the per-worker production function reflects the law of diminishing marginal returns • When applied to capital says that the more capital per worker there is already, the less additional output can be gained by increasing capital stock per worker even more • An increase in the amount of capital per worker is called capital deepening and is one source of rising labor productivity economic growth
PF' r e k r PF o y' w r e p y t u p t u O 0 Capital per worker Exhibit 3: Impact of a Technological Breakthrough Technological change usually improves the quality of capital and increases productivity, shown by the upward rotation from PF to PF' more output is produced at each level of capital per worker k
Economic Growth • Two kinds of changes in capital improve worker productivity • An increase in the quantity of capital per worker • is reflected by a movement along the per-worker production function • According to Simon Kuznets, changes in the quantities of labor and capital account for only one-tenth of the increase in economic growth • An improvement in the quality of capital per worker • is reflected by technological change that rotates the curve upward • Accounts for nine-tenths of the increase in economic growth • As technological breakthroughs become embodied in new capital, resources are combined in more efficient ways
Rules of the Game • Refers to the formal and informal institutions that promote economic activity • Laws, customs, conventions, and other institutional elements that encourage people to undertake productive activity • Stable political environment and system of well-defined property rights • Improvements in the rules of the game could result in more output for each level of capital upward rotation in the per-worker production function
Productivity / Growth in Practice • Differences in the standard of living among countries are profound • Per capita output in the U.S. is more than fifty times that of the world’s poorest countries • With only 5% of the world’s population, the U.S. produces more than all the nations comprising the bottom 50% of the world’s population put together • World’s economies can be sorted into two broad groups • Industrial market countries or developed countries • Developing or third-world countries
Industrial market countries • Developed countries which make up about 20% of the world’s population • Economically advanced capitalistic countries • Western Europe, North America, Australia, New Zealand, and Japan • Were the first to experience long-term economic growth and have the highest standard of living
Developing Countries • 80% of the world’s population • Have a lower standard of living because of relatively less human and physical capital • On average, the majority of workers in these countries are employed in agriculture
Education and Economic Development • Important source of productivity is the quality of labor • What exactly is the contribution of education to the process of economic development • Education makes workers aware of the latest production techniques • Makes workers more receptive to new ideas and methods • Countries with the most advanced educational systems were first to develop while developing economies have far lower levels of education
Exhibit 5: Long-Term Trends in Labor Productivity (Annual Averages by Decade) Average productivity growth since 1870 is 2.1% Source: Angus Maddison, Phases of Capitalist Development (New York; Oxford University Press, 1982) and Bureau of Labor Statistics. “Since 1990” includes 2000 and 2001.
Exhibit 6: U.S. Labor Productivity Growth Slowed During 1974-1982, then Rebounded Growth in labor productivity declined from an average of 2.9% per year between 1948 to 1973 to 0.8% in 1974 to 1982 Causes of slowdown: (1) increase in the price of oil between 1973 and 1974 (2) in the early 1970s environmental and safety laws required more costly production methods Rebound during the later years is directly related to the information revolution powered by the computer chip
Output Per Capita • Even if labor productivity did not increase, total output would grow if the quantity of labor increased • Labor productivity equals real GDP divided by the quantity of labor real GDP equals labor productivity times the quantity of labor • Therefore total output can grow as a result of greater labor productivity, more labor, or both
Output Per Capita • Output per capita • Real GDP divided by the population • Best measure of economy’s standard of living • Indicates how much an economy produces on average per person • Relationship between output per capita and labor productivity • Suppose labor productivity is $60,000 per worker per year • If there is one worker for every two people in the economy, then output per capital equals output per worker divided by 2 $60,000 / 2 = $30,000
Output Per Capita • Output will increase if • labor productivity increases for a given worker-population ratio • the worker-population ratio increases for given labor productivity • labor productivity and the worker-population both increase • In fact, output per capita would increase as long as an increase in one of these three factors more than offsets any decrease in the other two
Exhibit 7: Real GDP Per Capita Despite the six recessions indicated by the shading, real GDP per capita measured in 1996 dollars has nearly tripled, for an average growth rate of 2.3% Source: U.S. Dept. of Commerce, Survey of Current Business, 81 (July, 2001).
International Comparisons Converted to U.S. Dollars Average Annual Percent Growth Since 1983
Technological Change and Unemployment • Technological change usually reduces the number of workers needed to produce a given amount of output • Therefore, some fear that new technology will throw people out of work and lead to higher unemployment • However, it is also true that technological change can also increase production and employment by making products more affordable
Technological Change and Unemployment • If technological change caused unemployment • Then the slowdown in productivity growth that occurred from 1974 to 1982 should have resulted in lower unemployment than during the period of higher productivity growth from 1996 to 2001 • In fact, the unemployment rate during the former period was much higher than in the latter period • Also, if this argument were true, we should expect unemployment rates should be lower in the developing countries. Again, this is not borne out by the facts
Research and Development • Improvements in technology arise from scientific discovery, which is the fruit of research • We can distinguish between • Basic research • Search for knowledge without regard to how that knowledge will be used • First step toward technological advancement • Less immediate payoff yet yields a higher rate of return to society as a whole • Applied research • Seeks to answer particular questions or to apply scientific knowledge to the development of specific products
Research and Development • Since technological change is the fruit of research and development (R&D), investment in R&D reflects the economy’s efforts to improve productivity • One way to track R&D spending is to measure it relative to GDP • During the 1990s, R&D as a share of GDP in the U.S. ranked second among the major economies, behind only Japan
Research and Development • Business R&D is more likely to be targeted toward applied research and innovations • Averaged 1.9% of GDP in the 1990s • Only Japan had higher business R&D than the U.S. • R&D spending by governments and nonprofits may generate basic knowledge that has specific applications in the long run • For example, the Internet sprang from R&D spending on national defense
Convergence Theory Will poor countries eventually catch up with rich ones? • Convergence theory argues that developing countries can grow faster than advanced ones should eventually close the gap • It is easier to copy new technology once it is developed than to develop new technology • Thus countries that start out far behind can grow faster by copying technology
Convergence Theory • What’s the evidence on convergence? • Some poor countries have begun to catch up with the richer ones • Newly industrialized Asian economies of Hong Kong, Singapore, South Korea, and Taiwan • However, these “Asian Tigers” are more the exception than the rule • Among the nations that comprise the poorest third of the world’s population, consumption per capita has grown significantly slower than in the rest of the world the standard of living in these countries has fallen farther behind in relative terms
Convergence Theory • Reasons why the poorest countries have not gained • Birth rates are nearly double those in richer ones the poor economies must produce still more just to keep up with a growing population • Vast differences in the quality of human capital across countries • While technology may be portable, the knowledge, skill, and training required to take advantage of this technology may not be • Some countries lack the stable macroeconomic environment, established institutions, and infrastructures needed to nurture economic growth
Industrial Policy • Two concerns with respect to technologies of the future • They will require huge sums to develop and implement and firms may not easily raise or put at risk these large sums • Some technological breakthroughs spill over to other firms and other industries; thus the firm that develops the breakthrough may not be in a position to reap benefits from these spillover effects individual firms may under-invest in such research
Industrial Policy • One possible solution to these two problems was more government involvement through industrial policy • Industrial policy • Idea that government, using taxes, subsidies, regulations, and coordination in the private sector, could help nurture the industries and technologies of the future • Gives domestic industries and advantage over foreign competition with the objective one of securing a leading global role for domestic industries