
1’s 20 0’s
Why is C statistic the same as area under ROC curve? Example: 4 leaf tree, 100 1’s 100 0’s. 1’s 20 0’s. 1’s 20 0’s. 1’s 50 0’s. 1’s 10 0’s. Areas: (Number of 1’s)x(Number of 0’s). 40 1’s. 30 1’s. 20 1’s. 10 1’s. 10 0’s. 20 0’s. 50 0’s.

1’s 20 0’s
E N D
Presentation Transcript
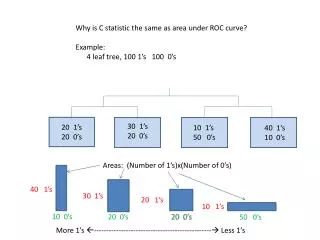
Why is C statistic the same as area under ROC curve? Example: 4 leaf tree, 100 1’s 100 0’s • 1’s • 20 0’s • 1’s • 20 0’s • 1’s • 50 0’s • 1’s • 10 0’s Areas: (Number of 1’s)x(Number of 0’s) 40 1’s 30 1’s 20 1’s 10 1’s 10 0’s 20 0’s 50 0’s More 1’s ------------------------------------------------ Less 1’s
40x90 Concordant Pairs IF cut is after 1st leaf 20+20+50 = 90 0’s CUT 40 1’s 30 1’s 20 1’s 10 1’s 10 0’s 20 0’s 50 0’s More 1’s ------------------------------------------------ Less 1’s
30x70 more Concordant Pairs IF cut is after 2nd 90x40 Concordant Pairs IF cut is after 1st leaf 20+50 = 70 0’s 40 1’s 30 1’s 20 1’s 10 1’s 10 0’s 20 0’s 50 0’s More 1’s ------------------------------------------------ Less 1’s
30x70 more Concordant Pairs IF cut is after 2nd CUT 40 1’s 30 1’s 20 1’s 10 1’s 10 0’s 20 0’s 50 0’s More 1’s ------------------------------------------------ Less 1’s
In terms of PROPORTIONS: ROC curve 0.10 1’s 0.10 prop. concordant Left of cut point => decide 1 Diagonal line coordinates at ends are (proportion 0’s declared 1’s, proportion 1’s declared 1’s) = (sensitivity , 1-specificity) !!! 0.20 1’s 0.21 proportion concordant 0.30 1’s 0.36 proportion concordant 0.40 1’s 0.10 0.20 0.20 0.50 proportions of 0’s = blue box widths Blue boxes are ties, proportions .4x.1=.04, .3x.2=.06, .2x.2=.04, .1x.5=.05 Proportion ties = .04+.06+.04+.05. Half of that = sum of blue triangles below diagonals = .02+.03+.02+.025 = .095. Area under ROC curve (black diagonal lines) is 0.36+0.21+0.10+0.095 = C = 0.765