Data Sources
Data Sources. GW Institute of Public Policy Innovative Data Sources for Regional Economic Analysis. 7-8 May 2012. 1. Use of Patent Data. Patent data contains indicators of I nnovative activity Value of innovation (citations, renewals, litigation)


Data Sources
E N D
Presentation Transcript
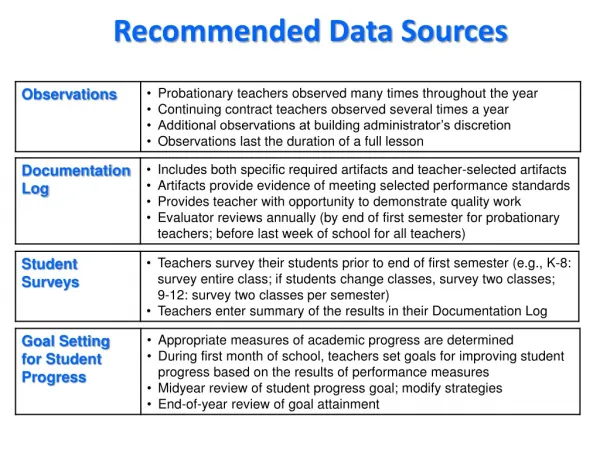
Data Sources GW Institute of Public Policy Innovative Data Sources for Regional Economic Analysis 7-8 May 2012 1
Use of Patent Data • Patent data contains indicators of • Innovative activity • Value of innovation (citations, renewals, litigation) • Knowledge flow (backward/forward citations) • Market for technology (assignments) • Qualifications • Non-patented innovations • Strategic patenting • Geographic origin/ownership/use • Limited inventor/assignee identity information 2
Patent Statistics & InformationPatent Statistics Reports • Calendar year aggregates of patent grants by • Geographic origin –inventor country/state • selected statistics by U.S. metro/micropolitan area • Inventor • Assignment (ownership) • Technology class (U.S. Patent Classification) • Limited breakouts by industry • manufacturing NAICSonly • Specifications • Coverage varies by report • Updated annually 3
Patent Statistics & Information Bulk Downloads • USPTO makes patent records available for bulk download at USPTO or Googleweb sites • XML or varying formats • Grants full text and bibliographic: 1976–present • Patent assignments: 1980–present • Published applications full text and bibliographic: 2001–present • Fixed-column format • Grant U. S. classification: 1790–present • Post-grant maintenance fee payments: 1981–present • Application U. S. classification: 2001–present • Specifications • Most products updated on weekly basis • Not immediately useable for research and analysis 4
Patent Statistics & InformationResearch Ready Datasets • USPTO makes some patent records available in more readily useable formats • Patent Bibliographic Data Extract DVD: 1975/1977–2011 • Patent Assignment Dataset: 1980–2011 5
Use of Trademark Data • Trademark data contains potential indicators of • Non-technological innovation (services, product, marketing) • Product market introduction/closer to market • Statement of use/commercialization • Value of intangible assets (renewals, product classes, oppositions) • Trade in intangible assets • Construction of families/brands • Qualifications • Geographic ownership/use • Broad product class definitions • Long renewal period (10 years) 6
Trademark Statistics & InformationBulk Downloads • USPTO makes trademark records available for bulk download at USPTO or Googleweb sites • XML, TIFF or JPG formats • Registration images:1870–present • Application text: 1884–present • Trademark assignments:1980–present • Trial and Appeal Board text: 1955–present • Application images: 2010–present • Specifications • Products updated on daily or monthly basis • Not immediately useable for research and analysis 7
Trademark Statistics & InformationResearch Ready Datasets • USPTO making some trademark records available in more readily useable formats • Trademark Casefile Dataset: 1884–2011 • Trademark Assignments Dataset: 1980–2011 8
Additional Resources • Search Tools • Individual Patents & Trademarks Online Search – PAIR, TESS, etc. • Patent & Trademark Resource Centers • USPTO On-site Search Facilities • USPTO Annual Reports • Patent & Trademark fiscal year performance and workload statistics • Data Visualization Center Dashboard • Patent & Trademark pendency, backlog, quality, processing statistics • Other • U.S. Patent Classification to NAICS concordance • Other regular reporting 9