Download

1 / 14
140 likes | 246 Vues
This report, presented at the Western Governors' Association WRAP Board Meeting in Salt Lake City, focuses on the assessment of emissions control strategies for stationary source NOx and PM. It highlights the significance of these emissions on visibility impairment and outlines the need for milestones to prevent net increases. The report stresses the requirement for a 2008 revision of the State Implementation Plan (SIP) with long-term strategies and BART requirements. Key findings indicate the growth of stationary sources and their contribution to haze, urging deeper evaluation and strategy development for air quality improvements.

E N D
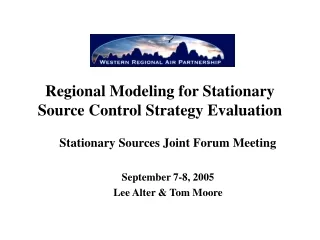
Summary of WRAP Stationary Source (SS)NOx and PM Report Lee Alter Western Governors’ Association WRAP Board Meeting Salt Lake City, UT October 15, 2003
Section 309(d)(4)(v) Requirements • SIPs “must include a report which assesses emissions control strategies for stationary source NOx and PM, and the degree of visibility impairment that would result from such strategies.” • The report must evaluate the need for milestones to avoid net increases and to support possible multipollutant and multisource programs. • The SIP must commit to a 2008 revision containing any necessary long-term strategies and BART requirements for stationary source NOx and PM.
Approach • Starting point for addressing stationary source NOx and PM emissions. • What is the relative significance of these emissions? • How should the WRAP address these sources more comprehensively over the next few years? • The report does not recommend strategies, control levels, or define BART.
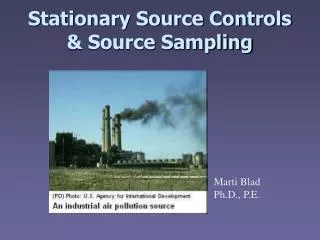
Stationary Source Emissions • Stationary sources are expected to grow. • Stationary source PM10 emissions may appear less important than NOx, but they contribute more to haze on a per ton basis.
SS NOx Emissions (1996) • 763 plants > 100 tpy • These account for 94% of SS emissions • ~150 are power plants
SS NOx Emissions > 100 tpy (1996) Utility Boilers Utility ICEs Industrial ICEs Industrial Boilers Industrial Processes
Utility Boilers Controls • Of the 99 dry-bottom coal-fired utility boilers in the 13 states in 1996 … • 14 had at least one control in the WRAP data • Modified Furnace/Burner Design (13), Low Excess Air Firing(1) • 45 had at least one control in the EPA/EIA data • Modified Furnace/Burner Design(13) , Low Excess Air Firing(1), Low NOx Burner(21), OFA(3), Misc.(7) • 68 had at least one control in the 2000 EPA/EIA data • Modified Furnace/Burner Design(13), Low Excess Air Firing(1), Low NOx Burner(41), OFA(9), Misc.(4)
SS Inventory Conclusions • WRAP is about to compile a 2002 inventory. • Inventory may be adequate for air quality modeling, but more information is needed for strategy development and evaluation. • For ICEs and NG production … • Check emission quantities • Improve classification and process descriptions • For utility and industrial boilers … • Improve data on controls in place • Include boiler capacity and design/process info
IMPROVE Monitoring Data (2001) Percent Light Extinction Due to Ammonium Nitrate on the 20% Worst Days • Percentages are higher when natural sources of haze are excluded • On some of the hazy days on the CP, nitrate is 40 - 60 % • Waiting for trend data
Inventory + Monitoring Suggests ... • Stationary source PM emissions probably cause less than: • 2% of the region’s visibility impairment • Stationary source NOx emissions probably cause about: • 2 - 5% of the impairment on the Colorado Plateau • 10% of the impairment in some other areas • Caveats • SS may have disproportionate influence • NOx influences formation of other PM species
WRAP Modeling Data (2018) • Sensitivity run to assess the need to avoid net increases. • 25% NOx and PM10 increase from all SS • Sensitivity runs to assess control strategies. • 50% NOx reduction from SS > 100 tpy • 50% PM10 reduction from SS > 100 tpy • Useful exercise. • Model performance not adequate. • Results presented for summer only. • Several improvements under way.
Also Found in the Report ... • Conceptual models of haze in the West. • Summary of control technologies, costs, and secondary impacts. • 34 technologies/practices. Most commercially available. Rest are near available. • With the exception of SCR, most achieve a 30-50% reduction at a cost of $300 - $1,200 per ton. • Costs highly dependent on boiler type, size, vintage, configuration, fuels, and existing controls.