Download
1 / 43
440 likes | 603 Vues
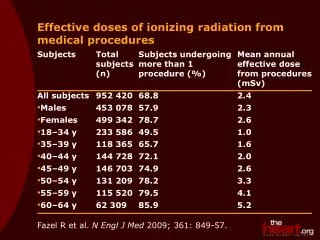
The Health Benefits of Exposure to Moderate Doses of Ionizing Radiation. Introduction. Many good epidemiological studies now exist showing that cancer mortality rates in humans can be reduced by 20% to 40% by exposure to moderate doses of nuclear radiation.

E N D
The Health Benefits of Exposure to Moderate Doses of Ionizing Radiation
Introduction Many good epidemiological studies now exist showing that cancer mortality rates in humans can be reducedby 20% to 40% by exposure to moderate doses of nuclear radiation. The effect is known as radiation hormesis. It has been shown to occur for one-time exposures of 5 to 50 rem, and also for long-term exposure to moderate dose rates. Hormesis has been observed following radiation exposure from medical sources, nuclear reactors, nuclear weapons, nuclear waste and radon.
Outline of Talk Review of radiation effects at high dose Historical highlights of radiation hormesis research Why the public fear of radiation? The linear, no-threshold model for radiation induced cancer Large scale human exposures and epidemiological studies Conclusion about radiation dose vs cancer rate What is going on? My opinion
Units of Dose Absorbed dose: 1 Gray = 1 Joule/kg Dose equivalent: dose equivalent (Seivert) = absorbed dose (Gray) x Q Q = 1 for low linear energy transfer particles (electrons) Q = 10 for alpha particles 1 Rad = 0.01 Gray 1 Rem = 0.01 Seivert
Acute Radiation Poisoning Death occurswithin about2 months. The main cause of death is immunodeficiency (septicemia by infection) due to bone marrow failure. After 2 months, recovery is usually sufficient to prevent death. The whole body dose at which 50% of the population is killed by acute radiation poisoning is about: 250 rem with little medical assistance 500 rem with extensive medical care 1000 rem possible with latest bone marrow treatments
Radiation Related Cancer Deaths For doses above about 100 rem (when they donot lead to death by acute radiation poisoning) some "excess" cancer deaths are observed . The time scale is shown schematically here for Hiroshima and Nagasaki survivors. There were 428excess deaths from 1950-1990 out of 4,863 cancer deaths. (Prepared by the Radiation Effects Research Foundation, Hiroshima, Japan).
Radiation Induced Cancer Rates Increased cancer mortality rates are statistically detectable at doses above about 100 rem. Examples are: Hiroshima and Nagasaki survivors (6035 people exposed to 50 to 200+ rem - 428 excess cancer deaths 1950 to 1990) Ankylosing Spondilitus patients (1935 to 1954, 14,000 patients get 300 rem X-rays to spine - 80 excess cancer deaths by 1970) Ankylosing spondilitis and spinal tuberculosis patients Before 1952, 900 patients received radium injections giving 900 rem to the bone - 54 excess bone cancers by 1974) Thorium injections (1928 to 1955, 3000 patients got several thousand rem to the liver - 300 excess liver cancers by 1977) Radium dial painters (1915 to 1935, 775 women received 1700 rem average to the bone - 48 excess bone cancers) Uranium miners (1920 to 1968, 4100 miners exposed to radon giving 6,000 rem average to bronchial surfaces - 134excess lung cancers by 1974)
Hormesis Coined in 1943, the term hormesisrefers to biological stimulation caused by low doses of agents that are harmful or lethal in high doses. Examples of other agents known to produce hormesis are alcohol (20% decrease in mortality rate due to moderate consumption) and antibiotics(fed to domestic animals to stimulate growth). Let's start by trying to establish some historical perspective on radiation hormesis and public fear of radiation.
Historical Highlights of Radiation Hormesis 1898 X-ray irradiated algae grow faster 1908 Stimulated growth in trees 1918 Increased invertebrate life span 1919 Increased insect life span 1937 X-ray stimulated plant growth 1940's Stimulated growth in guinea pigs, rabbits, mice 1950's Increased life span in rats, dogs, house flies 1960's and 1970's About 40 papers/year showing increased life spans in guinea pigs, rats, mice 1981 T. Luckey publishes review of over 1250 articles on radiation hormesis in CRC press monograph 1990's Good epidemiological studies appear for humans
An Example of Animal Studies Median age at death of male Sprague-Dawley rats which received regular doses of radiation for 1 year, starting at 4 months of age. The dose was spread uniformly over 16 hours of each day. Each group contained 22 rats. Peak life expectancy is at 2.5 rem/day. (L.D. Carlson and B. H. Jackson, Radiat. Res. 11 509-519, 1959)
Different Species Respond Differently Comparative survival time of mice subjected to continuous irradiation by gamma rays and by neutrons (assuming a quality factor of 10). Peak life expectancy is at 1 rem/week, and is only 10% above normal. (F. W. Spiers, “Radioisotopes in the human body: Physical and biological aspects”, 1968, p.234 (London: Academic).)
Why the Public Fear of Radiation? 1906 English radiotherapist dies of overexposure. 1925 18 female radium dial painters develop jaw necrosis and profound anemia after 5 years of tipping brushes with their lips. (30 year follow-up study of 1155 low dose radium dial painters showing reduced cancer, increased longevity, was ignored). 1926 X-rays found to produce genetic damage in fruit flies. X-rays become standard for producing fruit fly mutations. 1945 Hiroshima and Nagasaki bombings cause many acute radiation poisoning deaths. 1940's False alarm about high rates of inheritable genetic damage from Hiroshima, Nagasaki bombs. 1955 H. Muller predicts genetic catastrophe after nuclear war. 1957 Windscale reactor fire in England releases 20 curies of 131I, causing dire predictions of thousands of thyroid cancers (which never appeared).
Radiation and mutations At Hiroshima and Nagasaki, many irradiated pregnant women miscarried, and women irradiated early in pregnancy had babies with major physical defects. Hiroshima midwives wereasked to record every defect in babies born > 9 months after the bombing, to search for inherited defects. The midwives reported a frequency of defects several times anything that had ever been reported before! However a later control study in Osaka gave results indistinguishable from those found in Hiroshima - midwives do not report minor birth defects unless you ask them to! No significant increase in hereditary defects has been observed in subsequent studies. But the early Hiroshima results leaked out, and the myth that radiation causes inheritable birth defects is still widely believed.
Birth of the Radiation Safety Industry Until about 1950, it was commonly assumed that there was a safe dose below which no long term effects could be expected from ionizing radiation. Later, the belief that radiation induced cancer was caused by cell damage eventually led to the adoption of the linear dose rate, no threshold (LNT) model. This assumes that the induced cancer rate is proportional to dose, and is independent of doserate. It was recognized (at least initially) that this was probably a worst-case estimate. The fact that the evidence for radiation hormesis from animal experiments directly and massively contradicts the LNT model was ignored, apparently because the data disagreed with the accepted understanding of how radiation caused cancer.
The LNT Model Based on induced cancer mortality rates at large doses, a value of about 1 chance in 104/rem was adopted as the probability for dying of cancer as a result of whole-body radiation exposure. Radiation dose (rem) People exposedExpected deaths 100 100 1 10 1000 1 1 10000 1 0.1 100000 1 0.01 1000000 1 This is how the estimates of large numbers of deaths from Chernobyl were arrived at.
Large Scale Radiation Exposures of humans • High Altitudes • High background rate areas • High radon areas • Soviet weapons plant accident in 1957 • U.S. Naval shipyard workers (reactors) • Medical exposures • Hiroshima and Nagasaki Survivors • Chernobyl
Medical Radiation Exposure In 1989, data were published showing breast cancer mortality in 31,710 women who were being tested for TB and were examined by multiple fluoroscopy between 1930 and 1952 (A. B. Miller et al, N. Engl. J. Med. 321 1285-1289 1989).The bars are 95% confidence limits.
Shipyard Workers • In 1991, a report was made to DOE following a 13 year Johns Hopkins study of US nuclear shipyard workers. Three groups were compared: • 28,542 workers with lifetime doses > 5 mSv (with doses as high as 400 mSv, or 40 rem) • 10,462 workers with lifetime doses < 5 mSv • 33,352 non-nuclear workers • The three groups were selected from a pool of almost 700,000 workers, including about 108,000 nuclear workers. The groups were chosen so that, aside from radiation exposure, they were closely matched in age at hiring, type of work, and health care.
Shipyard Workers (cont.) The results are shown here for the group with dose > 5 mSv and the non-nuclear workers. The overall mortality of 0.76 for the > 5 mSv group is 16 standard deviations below 1.0. (G. M. Matanoski, Health Effects of Low Level Radiation in Shipyard Workers, Final Report, DOE DE-AC02-79 EV10095, 1991). The bars are 95% confidence limits.
Nuclear Waste 30 year study of 7,852 people from 22 villages in the Ural mountains who were exposed to radiation after a thermal explosion in a nuclear waste dump at a Soviet weapons plant, compared with non-irradiated controls from the same area. (Z. Jaworowski, Nukleonika 40 3-12, 1995)
Nuclear Weapons Mortality rate vs age of A-bomb survivors living in Nagasaki and of Nagasaki residents who were not exposed to radiation. After about age 55, the A-bomb survivors (solid lines) have lower death rates. (M. Mine et al, Japanese Journal Public Health 28: 337-342, 1981)
Radon (Misasa) Misasa is an urban area in Japan with radium spas. The residents of the city are continually exposed to high levels of radon in the air. The residents of the suburbs are not exposed to high radon levels. Relative mortality rates are shown for Misasa residents (black) and suburban residents (gray). (S. Kondo, Health Effects of Low Level Radiation, Osaka Japan: Kinki University Press Madison WI: Medical Physics Publishing, 1993)
Radon (USA) A 1995 study by a University of Pittsburgh group compared lung cancer mortality rate from 1970 to 1979 with average radon exposure, county by county in the USA. Counties were selected for adequate permanence of residence. The study covered 1601 counties, containing almost 90% of the population of the USA(B. L. Cohen, Health Physics 68 157-174, 1994). All of the counties within a given dose interval are combined. The bars show the standard deviation of the distribution of counties within each dose interval. The data have had the BEIR (National Academy of Sciences Committee on Biological Effects of Ionizing Radiation) IV correction for variations in smoking frequency applied to the expected lung cancer rate.
Radon (USA, cont.) The average residential radon level is 1.7 pCi/liter. The "theory"” line is derived by linear, no threshold extrapolation of death rates in uranium miners exposed to very high radon concentrations.
Compilation of Radon Studies Compilation of data points from 9 studies of lung cancer vs radon exposure. The data points with small uncertainties are from Cohen. (F. A. Seiler and J. L. Alvarez, submitted to Human and Ecological Risk Assessment)
Confounding Factors? • There has been much discussion about the Cohen Radon study because it is an ecological study - it compares averagelung cancer mortality rate withaverage radon exposure. Ecological studies are not mathematically equivalent to a case-by-case study, and are prone to certain potential biases. • The major potential problem is that the average exposure might not determine the average risk, since dose can vary widely within a county. Possible problems might be, for example: • Mortality is highly non-linear with dose, or there is a threshold (this cannot save the Linear-No-Threshold model, by definition!) • Confounding factors (eg. smoking) might correlate strongly with mortality or dose
Socioeconomic Factors Cohen's 1995 paper has a long discussion about the importance of the corrections for smoking, from which he concludes that it is not plausible that improper correction for smoking causes the apparent beneficial effects of radon. The possibility that there were socioeconomic confounding factors that correlate strongly with mortality or radiation dose was investigated in a recent paper by Cohen (B. L. Cohen, Health Physics 72, 114, 1997) for 100 possible socioeconomic factors. The data were divided into sets for the one third of counties containing the lowest, medium and highest degree of each possible factor. The behavior of the data was very similar across the 3 sets for each factor, but some of the results are worth showing.
males females m/m0 Males and Females The dashed curve is a linear + quadratic fit that is done county by county, and will be used in all of the figures, as a reference to show the behavior for all males and all females; r0=1.7 pc/l.
lowest medium highest males females Smoking Prevalence
lowest medium highest males females Percent of Earnings from Farming
north east north central south west males Geographic Region females
Effects of Background Rate Cancer mortality rates for the US white population, 1950 to 1967, by state and background dose. (N. A. Frigerio et al, The Argonne Radiological Impact Program, Environmental and Earth Sciences report ANL/ES-26). These locations have so many possible differences that the results are not convincing. However it is important that the results do not contradict the other evidence for radiation hormesis.
M/M0 1.0 Rem 0 100 0.6 Conclusion The relationship between radiation dose and cancer mortality rate for one-time exposures apparently looks something like this:
What is Going on? It is evident that cancer probability is notjust proportional to the amount of DNA damage caused by radiation. What could be going on? The following discussion is taken from a 1998 review by Myron Pollycove, who was then a Visiting Medical Fellow at the Nuclear Regulatory Commission, and who is Professor Emeritus at the Laboratory for Medicine and Radiology, University of California, San Francisco. The review, which has a good bibliography, can be found at: http://www.tmn.com/~eaglea/HTML2/REPORTS/POLLYCOV/POLLYCOV.HTM
What Causes Cancer? • Breathing! • 2-3% of all metabolized oxygen is converted to free radicals. • This results in an average of about 1 mutation/cell/day. • Accumulated damage to the cell decreases DNA damage-control capability, leading to aging and malignant growth.
~108 ~108 = Events/cell/day ( ) = Fraction of metabolic DNA damage from background radiation of 0.1 rem/year ~106 FREE RADICALS AND REACTIVE OXYGEN SPECIES DNA OXIDATIVE ADDUCTS ~102 MIS OR UNREPAIRED DNA ALTERATIONS ~1 MUTATIONS (~5x10⁻⁹) (~10-7 ) (~10-7) Prevention Removal Repair APOPTOSIS, NECROSIS DIFFERENTIATION IMMUNE RESPONSE ENZYMES CELL CYCLE CONTROL ANTIOXIDANTS Estimates based on published data. M. Pollycove and L. E. Feinendegen, unpublished.
Radiation Damage Background radiation (0.1 rem/year) produces ~10-7 mutations/cell/day. Metabolism produces ~1 mutation/cell/day. Thus radiation induced mutations would equal mutations from metabolic processes at a dose of 106 rem/year, or about 3,000 rem/day.
Antioxidant Response to Radiation Increased antioxidant SOD response and decreased lipid peroxide in rat brains induced by X-rays. (K. Yamaoka, Free Radical Biol. Med. 11 3-7, 1991).
Immune Response to Radiation Experimentally well established, if not well understood (T. Makinodan and S. J. James, Health Physics 59(1) 29-34, 1990). Mouse splenic cells primed with antigenic sheep red blood cells, and exposed to radiation. The mouse immune system is stimulated by radiation doses of roughly 5 to 65 rem, and is suppressed by doses above 75 rem.
Supporting Evidence • Pre-exposureto low level radiationhas been observed by many authors to produce stimulationof biological defense mechanisms in cells later exposed to high radiation, resulting in: • Increased survival rates • Reduced chromosome aberrations • Reduced induction of mutations • In at least one study, the reduction in the number of chromatid breaks in pre-irradiated human lymphocyte cells was traced to stimulated production of repair enzymes by the low level radiation.
Conclusion Myron Pollycove: “The biological effect of radiation is NOT determined by the number of mutations it produces, but by its effect on the biosystem that controls the relentless, enormous burden of oxidative DNA damage “. High dose radiation impairs this biosystem with consequent increase of metabolic mutations. Low dose radiation stimulates the DNA damage control biosystem with consequent decrease of metabolic mutations.
My Opinion The adoption of the LNT model for regulatory purposes resulted in a large industry dedicated to the elimination of the (evidently) imaginary risks of low to moderate radiation exposure. A similar approach is now being taken to chemicals that are carcinogenic in large doses, based on the assumption that they must be harmful at low doses also. Want to bet? In my opinion, the only reasonable approach to safety regulation is that if a supposed danger is too small to measure, it is too small to worry about.
On Statistical Significance This is from J. H. Fremlin, Power Production, What are the Risks?” (Adam Hilger, 1989). It shows a surprising relationship between lung cancer mortality and the location in the alphabet of the first letter in the name of a British city. The trick here is to find an excuse to leave out data points which do not agree with the hypothesis. In this case, 5 regions were excluded on the plausible sounding excuse that they were less industrialized”.