Download
1 / 46
460 likes | 573 Vues
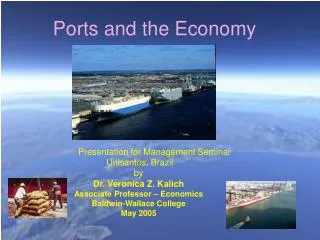
Northwest Ports and the Gateway Initiatives. Anne V. Goodchild Assistant Professor Department of Civil and Environmental Engineering University of Washington. Research. Port elasticity study with Dr. Leachman Impact of Port of Prince Rupert on regional trade Transportation resilience

E N D
Northwest Ports and the Gateway Initiatives Anne V. Goodchild Assistant Professor Department of Civil and Environmental Engineering University of Washington
Research • Port elasticity study with Dr. Leachman • Impact of Port of Prince Rupert on regional trade • Transportation resilience • Analysis of past disruptions at PR • Transloading and warehousing • Cross border research • Clean Trucks Program
Diversity in West Coast Ports • Growth pattern • Discretionary cargo • Approach to drayage truck emissions • Congestion • Landside infrastructure • Port access • Urban region
Discretionary Cargo • The cargo that doesn’t have to go through a particular port • The cargo that is transloaded • Importing via the East Coast is getting more competitive • Some companies have recently moved to a 4-5 port strategy • In this case consolidation-deconsolidation is less effective • With a one port strategy consolidation-deconsolidation is getting more competitive • $30 would remove transload volume in the Pacific Northwest • $30 would have very little impact on Southern California
The line to Prince Rupert is a spur line No alternative routes Required switching activities in Prince George
Reliability Threats Highway 16 west at Shames Flats and 3 to 4 km west of Shames Flats has opened to single lane alternating traffic as of noon June 10, 2007CN workers begin the long task of rebuilding the rail line between Terrace and Prince Rupert now that the Skeena has started to recede.
Distribution Centers • About 33% of Port of Seattle traffic use a warehouse in the Green River Valley (2005) • 18% of 2007 Port of Seattle traffic is transloaded • Provide capability to use consolidation-deconsolidation strategy • Provide economic benefit to importers from inventory management and transportation cost • Provide regional economic benefit
Unique elements of NW Ports • More price sensitive • More discretionary cargo • Less transloading • Relatively weak local demand • Regional/International competition • Regional/International cooperation • Servicing Alaska trade
Canada’s gateway and trade corridor initiative • Canada’s strategy has resulted in heavy investment in a “new” port • Not all cargo needs to move through a congested region • Has capacity • Consolidation activities in Vancouver • Separation of rehandled/local cargo from discretionary cargo • Primarily serving midwest markets
Currently PR serving US midwest Imports Exports SE Alaska continues to be served by Washington ports
US Policy • Growing consensus for a national freight program • National Surface Transportation Policy and Revenue Study Commission, AASHTO, ARTBA, NRC, ATA, AAPA, US Chamber, GAO • GAO recommends “a national strategy to transform the federal government’s involvement in freight transportation projects. This strategy should include defining federal and nonfederal stakeholder roles and using new and existing federal funding sources and mechanisms to support a targeted, efficient, and sustainable federal role.”
Policy Suggestions • National strategy for planning & investment • Merit-based criteria for prioritizing projects • Predictable, dedicated, sustained funding for freight infrastructure • Partnership with the private sector to anticipate and meet the needs of system users • New user fees
Growing Coalition • Coalition for America’s Gateways and Trade Corridors National Freight Mobility Infrastructure Act • Creates National Freight Mobility Infrastructure Fund • Merit-based distribution criteria • Multi-modal eligibility • National in focus • Creates New Funding Mechanism • 1% tax of the cost of transportation of ALL goods (domestic and international; all modes)
Open Questions • Being closer to Asia is a significant asset • Significant economic activity will occur in Prince Rupert • Transit of containers between Canada and the US is not a deterrent • Container management
Prince Rupert Container TerminalPerformance to 11-March-08 • 19 Vessel Calls • All vessels arrived & departed on schedule • Off loading/loading 22 containers/hour • 35,600 TEUs handled • 36.5% Backhaul - fully laden containers (less than Seattle, Tacoma, and Vancouver) • Maximum Dwell Time: 2 Days • 100% of containers scanned for radiation
Container Management • Containers imported into Canada must leave the country within 30 days • They can only be used for one repositioning move • This may favor the delivery of containers to the US, where laws are less restrictive • Most shipping lines are under contract to balance east and westbound moves and are subject to penalties if they are not • Unless export potential is exploited, it will be expensive for shippers to return the containers to Prince Rupert, impacting the total cost
Prince Rupert Terminals CONTAINER TERMINAL Phase 1 & 2 WATER DEPTH Inner Harbour: 35 - 44 metres Wharf: 18.7 metres CONTAINER TERMINAL 2 Grain Terminal Coal/Sulphur/Wood Pellet Terminal Ridley Island
Demand • Shipping lines will decide whether or not to use Prince Rupert • They will choose to use it if meets their needs to control cost while maintaining service quality and reliability • There is a complex web of relationships and economics that drive these decisions • Demand for shipping line services is driven by shipper demands, and is a function of cost • Shippers will find it more attractive to use Prince Rupert if they can finance the cost of the return trip with exports • They will choose to service Prince Rupert first if import demand is of high volume and high priority
Reliability • Lean supply chains are a source of competitive advantage • Increased length, frequency of disruption • Shippers are looking for reliability (uncertainty is the enemy of logistics) • e.g. • Port of Seattle 2005 volume increase • Walmart moves to a 5 port US import strategy
Prince Rupert Advantage – Hong Kong Prince Rupert Vancouver Seattle Distance from Hong Kong (Nautical Miles)5,286 5,777 5,768 Los Angeles 6,380
Prince Rupert Advantage – Kobe Prince Rupert Vancouver Seattle Distance from Kobe, JA (Nautical Miles)4,101 4,554 4,536 Los Angeles 5,137
Prince Rupert Prince George Edmonton – 39 hrs Saskatoon – 47 hrs Calgary Winnipeg – 61 hrs Vancouver – 61 hrs Halifax Halifax Montreal – 115 hrs Toronto – 108 hrs Chicago – 99 hrs Memphis Competition UP/Los Angeles – 112 hrs UP/Seattle – 120 hrs BNSF/Los Angeles – 130 hrs Memphis – 117 hrs New Orleans
Export/Backhaul Opportunities forest products recycled paper Alaska and BC seafood soybean cotton beef • special agricultural products • - pulses, grains, oilseeds • malt, cubes, pellets, hay poultry pork milk Leather/ hides bottled water
Port of Prince Rupert – Export Backhaul Opportunities • Alaska and local Seafood (est. 75,000 – 100,000 TEUs per annum) • Pork (est. 100,000 – 160,000 TEUs per annum) • Beef (est. 40,000 – 80,000 TEUs per annum) • Forest Products (est. 120,000+ TEUs per annum) • Special Agricultural Products (est. 60,000 – 100,000 TEUs per annum) • Pulses - Grains and Oilseeds • Malt - Cubes, Pellets, Hay • Other (originating in Chicago-Memphis area) • Cotton (est. 160,000 - 180,000 TEUs per annum) • Recycled paper (est. 40,000 - 100,000 TEUs per annum) • Soybeans (est. 130,000 to 170,000 TEUs per annum) • Petrochemicals/plastics (to be determined) • Developmental (to be determined) • Log and modular home manufacture • Bottled water
Port of Prince Rupert – Sample Initiatives to Stimulate Export Traffic • Prince George Inland Port • 120,000 TEU’s of forest products annually • Grand Prairie Intermodal Container Facility • $2.5 million of land donated by Alberta Gov’t. • Access improvements to CN Intermodal in Saskatoon • $20 million from the APCGI. • Access improvements to CPR Intermodal in Edmonton • $75 million from the APCGI. • CN Edmonton Grain Distribution Centre • $4 million facility opened Nov. 16, 2006 • Handling high-value specialty crops • Gap Analysis-identified Opportunities • Container Services: refrigeration, stuffing, storage & repair • Bonded warehousing • Ridley Island Logistics Park
International Intermodal Freight • West Coast handles the vast majority of Asian imports • Moved via landbridge to midwest and East Coast (double stack trains) • Rapid growth in container volumes as Asian imports have grown
Port of Seattle • 4 container terminals, 25 cranes • Natural deep water harbor • 4 RR routes to inland markets (2 major RR hubs within 1 mile) • 10 container berths up to 50 ft (15 m) • Vessel calls: 1,221 (2007) • TEUs (2007): 1,973,504 • Containerized metric tons (2007): 14,584,816
Port of Tacoma • 5 container terminals • 4 dockside intermodal rail yards • Upland infrastructure with road network & easy access to interstate system • Natural deep water port • Available land for expansion
Port of Vancouver • TEUs (2007): 2,307,289 (increase to 4 million by 2012) • Million tons/cargo (2007): 82.7 • 17 bulk terminals, 25 marine cargo terminals • Linked to 3 RR with double stack capacity
Prince Rupert Port • > 98% marine to rail intermodal • Annual capacity: 500,000 TEUs • 360 metre container quay • 18.7 metre berth depth • 3 Ultra Post Panamax Cranes • 7 working tracks (5,500m), 6 storage tracks (6,100m)
Leachman • For direct inland movement of marine boxes, the break point in declared value at which it is cheaper to import via the West Coast instead of all-water movement to Eastern markets fell from $46 to $40 per cubic foot.