Science: Measurement, Uncertainty, and Error
200 likes | 221 Vues
Explore sources of error, types of uncertainties, precision, accuracy in measurements, deal with errors, and calculate uncertainties in scientific data effectively.

Science: Measurement, Uncertainty, and Error
E N D
Presentation Transcript
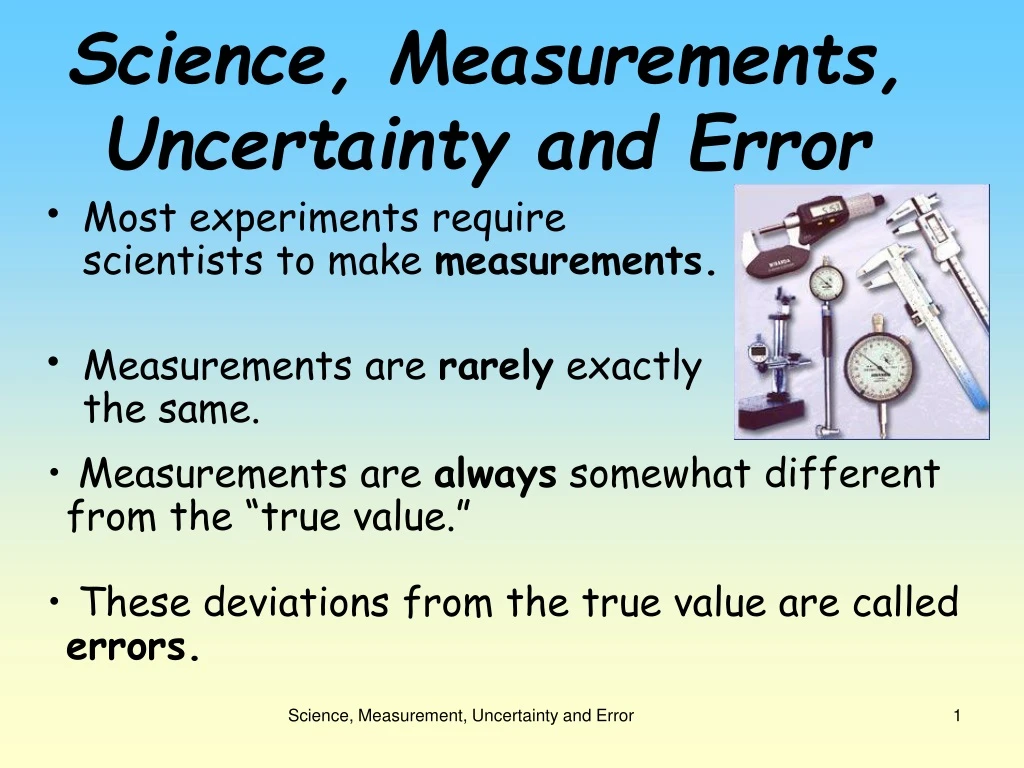
Science, Measurements, Uncertainty and Error • Most experiments require scientists to make measurements. • Measurements are rarely exactly the same. • Measurements are always somewhat different from the “true value.” • These deviations from the true value are called errors. Science, Measurement, Uncertainty and Error
Sources of Error • Two sources of error in a measurement are • limitations in the sensitivity of the instruments • imperfections in experimental design or measurement techniques • Errors are often classified as: • Random • Systematic www.nabis.govt.nz Science, Measurement, Uncertainty and Error
ALWAYS present. Measurements are often shown as: Measurement ± Random Error Sources: Operator errors Changes in experimental conditions How to minimize them? Take repeated measurements and calculate their average. Random Errors Science, Measurement, Uncertainty and Error
Sources: Instrumental, physical and human limitations. Example: Device is out-of calibration. How to minimize them? Careful calibration. Best possible techniques. Are TYPICALLY present. Measurements are given as: Measurement + Systematic Error OR Measurement - Systematic Error Systematic Errors Science, Measurement, Uncertainty and Error
Precision How reproducible are measurements? Accuracy How close are the measurements to the true value. Precision and Accuracy in Measurements Science, Measurement, Uncertainty and Error
Dartboard analogy • Imagine a person throwing darts, trying to hit the bulls-eye. Not accurate Not precise Accurate Not precise Not accurate Precise Accurate Precise Science, Measurement, Uncertainty and Error
Precision of a Measurement • The last digit is an estimate. • The precision is limited by the instrument. Measurement ≈ 26.13 cm Science, Measurement, Uncertainty and Error
Scientific Data The precision and accuracy are limited by the instrumentation and data gathering techniques. Scientists always want the most precise and accurate experimental data. Science, Measurement, Uncertainty and Error
Dealing with Errors • Identify the errors and their magnitude. • Try to reduce the magnitude of the error. HOW? • Better instruments • Better experimental design • Collect a lot of data Science, Measurement, Uncertainty and Error
State uncertainties as absolute, fractional and percentage uncertainties. • Absolute uncertaintiesWhen marking the absolute uncertainty in a piece of data, we simply add ± 1 of the smallest significant figure. Example: 13.21 m ± 0.01 0.002 g ± 0.001 1.2 s ± 0.1 12 V ± 1 • Fractional uncertaintiesTo calculate the fractional uncertainty of a piece of data we simply divide the uncertainty by the value of the data. Example: 1.2 s ± 0.1Fractional uncertainty: 0.1 / 1.2 = 0.0625 Science, Measurement, Uncertainty and Error
Percentage uncertaintiesTo calculate the percentage uncertainty of a piece of data we simply multiply the fractional uncertainty by 100. Example: 1.2 s ± 0.1 Percentage uncertainty: 0.1 / 1.2 x 100 = 6.25 % Science, Measurement, Uncertainty and Error
Determine the uncertainties in results. Simply displaying the uncertainty in data is not enough, we need to include it in any calculations. • Addition and subtractionWhen performing additions and subtractions we simply need to add together the absolute uncertainties. Example: Add 1.2 ± 0.1, 12.01 ± 0.01, 7.21 ± 0.01 1.2 + 12.01 + 7.21 = 20.42 0.1 + 0.01 + 0.01 = 0.12 20.42 ± 0.12 Science, Measurement, Uncertainty and Error
Multiplication, division and powersWhen performing multiplications and divisions, or, dealing with powers, we simply add together the percentage uncertainties. Example: Multiply 1.2 ± 0.1, 12.01 ± 0.01 1.2 x 12.01 = 140.1 / 1.2 x 100 = 8.33 %0.01 / 12.01 X 100 = 0.083%8.33 + 0.083 = 8.413 % 14 ± 8.413 % Science, Measurement, Uncertainty and Error
For other functions, such as trigonometric ones, we calculate the mean, highest and lowest value to determine the uncertainty range. To do this, we calculate a result using the given values as normal, with added error margin and subtracted error margin. We then check the difference between the best value and the ones with added and subtracted error margin and use the largest difference as the error margin in the result. Example: Calculate the area of a field if it's length is 12 ± 1 m and width is 7 ± 0.2 m. Science, Measurement, Uncertainty and Error
Example: Calculate the area of a field if it's length is 12 ± 1 m and width is 7 ± 0.2 m. Best value for area: 12 x 7 = 84 m2 Highest value for area: 13 x 7.2 = 93.6 m2 Lowest value for area: 11 x 6.8 = 74.8 m2 If we round the values we get an area of: 84 ± 10 m2 Science, Measurement, Uncertainty and Error
Identify uncertainties as error bars in graphs. When representing data as a graph, we represent uncertainty in the data points by adding error bars. We can see the uncertainty range by checking the length of the error bars in each direction. Example: Plot the following data onto a graph taking into account the uncertainty. Science, Measurement, Uncertainty and Error
State random uncertainty as an uncertainty range (±) and represent it graphically as an "error bar". In IB physics, error bars only need to be used when the uncertainty in one or both of the plotted quantities are significant. NOTE: Error bars are not required for trigonometric and logarithmic functions. Science, Measurement, Uncertainty and Error
Determine the uncertainties in the gradient (slope) and intercepts of a straight- line graph. Gradient: To calculate the uncertainty in the gradient, we simply draw a straight line passing through the lowest error bar of the one points and the highest in the other and vice versa. This gives two lines, one with the highest possible gradient and one with the lowest. We then calculate the gradient of each line and compare it to the best value. Science, Measurement, Uncertainty and Error
Intercept: To calculate the uncertainty in the intercept, we do the same thing as when calculating the uncertainty in gradient. This time however, we check the lowest, highest and best value for the intercept. Science, Measurement, Uncertainty and Error
Bad news… • No matter how good you are… there will always be errors. • The question is… How to deal with them? • Use … Science, Measurement, Uncertainty and Error