Starter
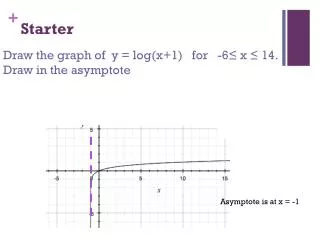
Starter. Draw the graph of y = log(x+1) for -6≤ x ≤ 14. Draw in the asymptote. Asymptote is at x = -1. Note 9 : Periodic Functions. Periodic Function A function that repeats itself over and over is a horizontal direction. Period of a Function

Starter
E N D
Presentation Transcript
Starter Draw the graph of y = log(x+1) for -6≤ x ≤ 14. Draw in the asymptote Asymptote is at x = -1
Note 9: Periodic Functions Periodic Function A function that repeats itself over and over is a horizontal direction. Period of a Function The length of one repetition of the function. Principal Axis The horizontal line that the function oscillates about. Principal axis = maximum + minimum 2
Amplitude The vertical distance from the principal axis to the maximum or to the minimum point. Amplitude = maximum – minimum 2
Note 10: Sine and Cosine Curve Draw an accurate sketch of the Sine and Cosine Curve: x-axis from 0° to 360° - plot every 30° y-axis from -1 to 1 – plot every 0.25
Characteristics of the Sine and Cosine Curve • The period is 360° • The amplitude is 1 • The maximum value is 1 and minimum value is -1 • The domain is: 0° < x < 360° • The range is: -1 < y < 1 • The cosine curve is just the sine curve shifted by 90°
Investigation 1: Using technology plot the following: y = sinx y = 3sinx y = 0.5sinx For each graph: • Find the maximum and minimum value • Find the period and amplitude Describe the effect of a in the function y = asinx • What is the amplitude of: y = 4sinx y = ⅔sinx
Investigation 2: Using technology plot the following: y = cosx y = cos2x y = cos(0.5x) For each graph: • Find the maximum and minimum value • Find the period and amplitude Describe the effect of b in the function y = cosbx • What is the period of: y = cos4x y = cos¼x
Investigation 3: Using technology plot the following: y = sinx + 2 y = sinx – 1 For each graph: • Find the maximum and minimum value • Find the period and amplitude • Calculate the equation of the principal axis What is the connection between: y = sinx y = sinx + c
IN GENERAL: y = AsinBx + C To find: • Period = 360/B • Principal axis y = C Affects Amplitude Affects Period Affects Principal Axis
Examples: Sketch the following graphs: • y = 2sinx + 4 • y = -3sin2x • y = sin(0.5X) - 2 Find for each graph: Maximum Minimum Amplitude Principal Axis Period