Download

1 / 39
390 likes | 747 Vues
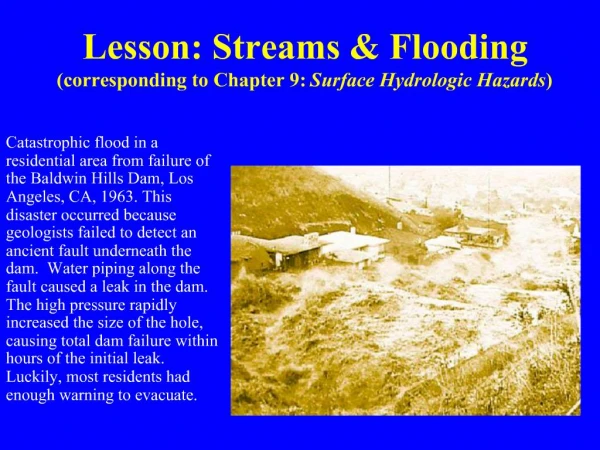
Water Quality in Lakes & Streams. CIVE 4312. Introduction. Water quality management is the science that predicts how much waste is too much for a body of water Assimilated - amount of waste that can be tolerated by a body of water

E N D
Water Quality in Lakes & Streams CIVE 4312
Introduction • Water quality management is the science that predicts how much waste is too much for a body of water • Assimilated-amount of waste that can be tolerated by a body of water • Determined by knowing the type of pollutants discharged and their effect on water quality
Water Quality Management • Water quality is affected by natural factors: • Historical uses in the watershed • Geometry of the watershed area • Climate of the region • Good water quality protects drinking water as well as wildlife
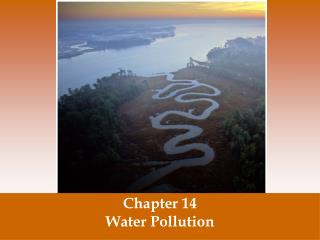
Point Sources of Pollutants • Point sources include domestic sewage and industrial wastes • Point sources -collected by a network of pipes or channels and conveyed to a single point of discharge in receiving water • Municipal sewage -domestic sewage and industrial wastes that are discharged into sanitary sewers - hopefully treated • Point source pollution can be controlled by waste minimization and proper wastewater treatment
Nonpoint Sources • Urban and agricultural runoff that are characterized by overland discharge • This type of pollution occurs during rainstorms and spring snowmelt • Pollution can be reduced by changing land use practices
Combined Sewer Flow • Nonpoint pollution from urban storm water collects in combined sewers • Combined sewers- carry both storm water and municipal sewage - older cities
Combined Sewer Overflow • Eliminating this involves: • Construction of separate storm and sanitary sewers • Creation of storm water retention basins • Expanded treatment facilities to treat the storm water • Combined sewers are not prohibited by the U.S. because removal would disrupt streets, utilities, and commercial activities
Oxygen- Demanding MATERIAL • Dissolved Oxygen (DO)-fish and other higher forms of aquatic life that must have oxygen to live • Oxygen- Demanding Material-anything that can be oxidized in the receiving water resulting in the consumption of dissolved molecular oxygen - BOD, COD • Almost all naturally occurring organic matter contributes to the depletion of DO
Nutrients • Nitrogen and phosphorus are considered pollutants when too much present in high conc. • High levels of nutrients cause disturbances in the food web • Organisms grow rapidly at the expense of others • Major sources of nutrients (N, P): • Phosphorus-based detergent • Fertilizer and agricultural runoff • Food-processing wastes • Animal and human waste
Pathogenic Organisms • Include bacteria, viruses, and protozoa from diseased persons or animals • Water is made unsafe for drinking, swimming, and fishing • Antibiotic-resistant bacteria are the most dangerous • Bacteria are found in both urban and rural environments with no observable pattern
Pathogenic Organisms Serious Outbreaks of these cause great suffering • E. Coli - indicator of fecal coliform bacteria • Salmonella (typhoid fever) • Shigella (dysentery) • Cryptosporidium - protozoa • Giardia- protozoa
Suspended Solids • Suspended solids-organic and inorganic particles that are carried by wastewater into a receiving water • A slower flow causes particles to settle and form sediment • Colloidal particles-do not settle, cause an increase in the turbidity of surface water • Organic suspended solids- exert oxygen demand • Inorganic suspended solids- result from soil erosion
Suspended Solids • With an increase in the amount of sediment comes: • Increase of turbidity • Decrease of light penetration • Increase in amount of bacteria • Increase in solids settled on the bottom which causes animal habitats to be destroyed
Salts • Total dissolved solids - TDS • Water collects salt as it passes over soil during irrigation practice • Too much salt can cause crop damage and soil poisoning • Arid regions - west and south Texas
Toxic metals and toxic organic compounds • Agricultural runoff contains pesticides and herbicides • Urban runoff contains zinc - from tires • Too many toxic metals and toxic organic substances can leave a body of water useless • James River in Virginia • Passaic River in New Jersey • Toxic compounds can also make fish and shellfish unsafe to eat - As, Hg, Pb, and PCBs • The new concern is pharmaceutical chemicals in water and wastewater
Endocrine-Disrupting Chemicals (EDCs) • These include • Polychlorinated biphenyls • Pesticides • Phthalates • No suitable method exists to characterize EDC’s • Can mimic estrogens, androgens, or thyroid hormones • Interfere with regular animal reproduction • Affects synthesis of hormones in the body
Arsenic • A naturally occurring element - As2O3 of real concern. • Caused by minerals dissolving naturally from weathered rocks and soils - iron oxides and sulfides • Causes many health effects such as: • Arsenic poisoning - interfere with ATP cycle • Circulatory disorders • Gastrointestinal upsets • Diabetes • Skin lesions & possible skin cancers • Created a huge problem in Bangladesh wells in 1992
Arsenic - October, 2001 • EPA lowered the MCL from 50 to 10 ug/L • Mostly a problem in western U.S. and the Midwest - naturally occurring • Lifetime excess risk translates to 30/10,000 • Compares to other carcinogens - 1/105 to 1/106 • Major concern in water supplies now
Heat Impacts • An increase in the Temp of water can cause: • Increase in DO which leads to a deterioration in water quality • Large fish kills • Blocked migration of fish • Altered genetic makeup in fish
Taste and Odor Problems • An increase in MTBE concentration in water • Releases from USTs and watercraft engines • Has impacted many lakes nationwide • Created serious taste and odor problems • City of Dallas shut down main water supply intakes due to largest pipeline spill in the U.S. in 2000 • City of Santa Monica closed main wells - 1999 • Many private wells impacted by MTBE
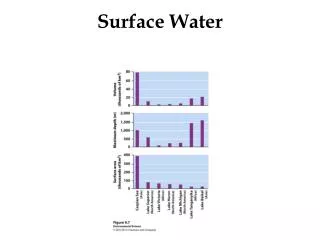
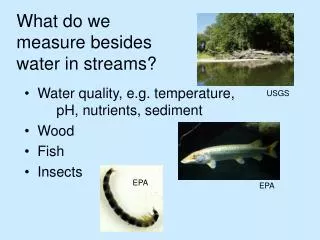
Water quality management in rivers • Main goal is to control the discharge of pollutants so that water quality is not degraded above the natural background level • Controlling waste involves: • Measuring pollutants levels (x,z, t) • Predicting their effect on the water quality • Determining background water quality that would be present without human intervention • Evaluate the levels acceptable for intended uses of the water
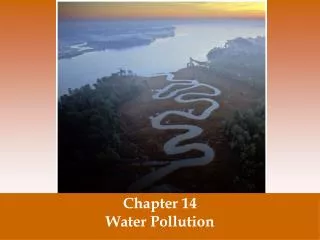
River Pollution Impacts Receptor Waste Input
Simple Mass Balance Input rate - Output rate - decay rate = Accumulation rate Steady state conservative system Stream Qs, Cs C = Qw Cw + Qs Cs Qs + Qw Waste Input Qw, Cw
Simple Mass Balance Input rate - Output rate - decay rate = Accumulation rate Steady state conservative system Qs = 10 m3/s Cs =20 mg/L 26.67 mg/L C = 20 (10) + 40 (5) (10 + 5) Waste Input Qw = 5 m3/s Cw = 40 mg/L
Transport characteristics that affect concentration • Velocity • Dilution (mixing) • Dispersion • Degradation (mass loss) • Adsorption (to soils) • Sedimentation (to bottom) • Aquatic Life (attached) v
Effect of Oxygen-demanding wastes on rivers • Depletes the dissolved oxygen in water • Threatens aquatic life that require DO • Concentration of DO in a river is determined by the rates of photosynthesis of aquatic plants and the rate of oxygen consumed by organisms
Biochemical oxygen demand • Biochemical oxygen demand (BOD)-oxidation of an organic compound is carried out by microorganisms using the organic matter as a food source • Biossay-to measure by biological means • BOD is measured by finding the change in dissolved oxygen concentration before and after bacteria is added to consume organic matter
Biochemical oxygen demand • Aerobic decomposition-when organisms use oxygen to consume waste • The rate at which oxygen is consumed is directly proportional to the concentration of degradable organic matter remaining at any time • BOD is a first order reaction L = BOD dL/dt = -kL Lt = Lo e-kt where Lo = ultimate BOD
BOD • Ultimate BOD-maximum amount of oxygen consumption possible when waste has been completely degraded • Numerical value of the rate constant k of BOD depends on: • Nature of waste and T • Ability of organisms in the system to use the waste
Nature of the waste • Materials that are rapidly degraded have large BOD constants • Materials that degrade slowly are almost undegradable in the BOD test • BOD rate constant depends on the relative proportions of the various components • Easily degradable organics are more completely removed than less readily degradable organics during wastewater treatment
Ability of Organisms to use waste • Many organic compounds can be degraded by only a small group of microorganisms • The population of organisms that can most efficiently use wastes predominates • BOD test should always be conducted with organisms that have been acclimated to the waste • This created a rate constant that can be compared to that in the river
Temperature • Oxygen use speeds up as the temperature increases and slows down as the temperature decreases • Oxygen use is caused by the metabolism of microorganisms • BOD rate constants depend on: • Temperature of receiving water throughout the year • Comparing data from various locations at different T values
Temperature Eqns • The BOD rate constant is adjusted to the temperature of receiving water using this: kT=k20()T-20 • T= temperature of interest (in °C) • kT= BOD rate constant at the temperature of interest(in days -1) • k20= BOD rate constant determined at 20 °C (in days -1) • = temperature coefficient.
5 day Bod test • A special 300 mL BOD bottle is filled with a sample of water that has been appropriately diluted and inoculated with microorganisms • Blank samples containing only the dilution water are also placed in BOD bottles and sealed • The sealed BOD bottles containing diluted samples and blanks are incubated in the dark at 20°C for the desired number of days • After five days has elapsed, the samples and blanks are removed from the incubator and the dissolved oxygen concentration in each bottle is measured.
Dissolved Oxygen DO • If the discharge of oxygen- demanding wastes is within the self-purification capacity, the DO is high • If the amount of waste increases, it can result in detrimental changes in plant and animal life • Aquatic life cannot survive without DO • Objective of water quality management is to assess the capability of a stream to absorb waste
Do Sag Curve • DO concentration dips as oxygen-demanding materials are oxidized and then rises as oxygen is replenished from atmosphere and photosynthesis • Major sources of oxygen: • Reaeration from the atmosphere • Photosynthesis of aquatic plants • Factors of oxygen depletion: • BOD of waste discharge • DO in waste discharge is less than that in the river • Nonpoint source pollution • Respiration of organisms and aquatic plants
Oxygen Deficit Equation Define deficit D = DOs - DO in mg/L L = ultimate BOD (mg/L) V (dD/dx) = kd L - kr D Where kd = deoxygenation rate constant (day-1) kr = reaeration rate constant (day-1) Since t = x / V, can write the above in time as dD/dt = kd L - kr D (reaeration vs oxygen use) Solution to this eqn gives the DO sag curve
Oxygen Deficit Equation At t = 0, D = Da and L = La - Initial values Solving the equation for Dt = deficit at any time t Dt = kdLa e-kd t - e-kr t + Da e-kr t Kr - kd Critical DO Dt = DOs - DO DO X