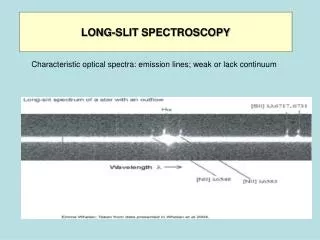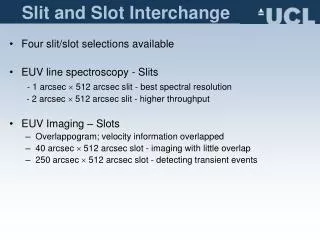
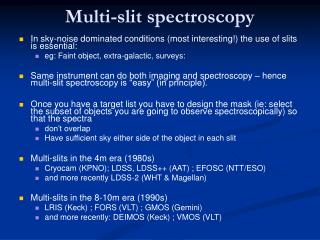
Multi-slit spectroscopy
Multi-slit spectroscopy. In sky-noise dominated conditions (most interesting!) the use of slits is essential: eg: Faint object, extra-galactic, surveys: Same instrument can do both imaging and spectroscopy – hence multi-slit spectroscopy is “easy” (in principle).

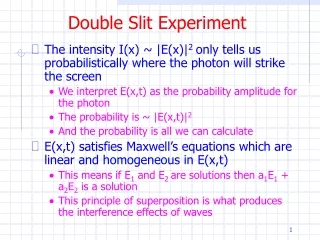
Multi-slit spectroscopy
E N D
Presentation Transcript
Multi-slit spectroscopy • In sky-noise dominated conditions (most interesting!) the use of slits is essential: • eg: Faint object, extra-galactic, surveys: • Same instrument can do both imaging and spectroscopy – hence multi-slit spectroscopy is “easy” (in principle). • Once you have a target list you have to design the mask (ie: select the subset of objects you are going to observe spectroscopically) so that the spectra • don’t overlap • Have sufficient sky either side of the object in each slit • Multi-slits in the 4m era (1980s) • Cryocam (KPNO); LDSS, LDSS++ (AAT) ; EFOSC (NTT/ESO) • and more recently LDSS-2 (WHT & Magellan) • Multi-slits in the 8-10m era (1990s) • LRIS (Keck) ; FORS (VLT) ; GMOS (Gemini) • and more recently: DEIMOS (Keck) ; VMOS (VLT)
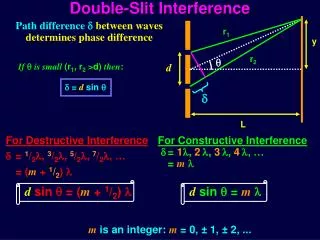
Spectrograph Focal Plane collimator camera detector Dispersing element Slit Telescope Spectrograph Figure 3.1
Multislit spectroscopy Example of multislit spectrometer Easier to achieve at telescope (can use holes in a mask) but preparation and reduction more complex Need to ensure spectra don’t overlap
LDSS-2mask superimposed on sky image Great care has to be taken in selecting objects to study so that they don’t overlap in wavelength direction. Also need objects of similar brightness so the SNRs are similar. Mask optimization is NOT trivial! Field acquisition is NOT trivial
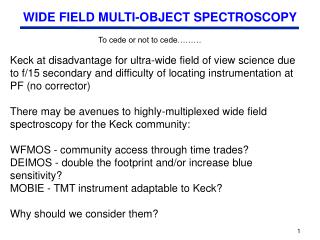
Multi-Object Spectroscopy (what could be simpler than ….) Slitless spectroscopy: • Point-like sources (eg: stars, distant galaxies etc.) can be observed spectroscopically without the use of a slit to define their input aperture. • In this case d is defined by the dispersive power combined with the instrinsic (angular) size of the object (usually defined by the seeing). • Thus an imaging system incorperating a dispersive element can, in principle, give the spectra of all objects within the field. This can be enormously powerful.
Slitless Spectroscopy Classic Example: • Objective Prism on the UK Schmidt Telescope (full aperture). Spectra of all objects (105 – 106) above sky background can be obtained over the full 6º field of view. But … • While light from point source is dispersed (and hence has lower flux density), light from background remains the same. Contrast between object and sky is reduced. This is why you need slits! • Spectra overlap in -direction (try rotating the prism by 90º) • Both argue for ultra-low dispersion and resolution • Palomar Schmidt system gives <1,000Å/mm (R ~200 at best) – crude IDs and red-shifts of bright galaxies
Corrector + Objective Prisms (full aperture) Primary Mirror Picture of Palomar Schmidt prism with sample spectra
Special case of slit-less spectroscopy (emission-line point sources) • Emission-line point sources don’t overlap (in general). Examples: • L galaxies at high redshift • Distant HII galaxies, HII regions, H-H Objects … • Classic case: • Planetary Nebulae
E-galaxy with kinematic mass tracers Globular Clusters? Planetary Nebulae? So what about PNe inExternal Galaxies? • Certainly emission line sources • Also distant enough to be point sources
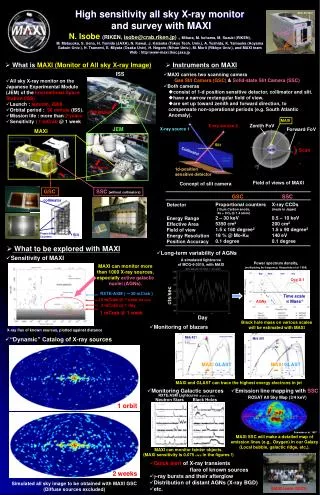
Detection of PNe in E-Galaxies and their use as kinematic probes • PNe are very effective “standard candles” • Flux can be used to measure distances to E-Galaxies • Radial motion of PNe can be used to map the dynamical motions within an E-Galaxies • V. difficult otherwise since need high SNR continuum spectra of faint outer envelope • With PNe can trace mass and “shape” of E-Galaxies • How? • PNe are point-like • PNe spectra are dominated by pure narrow emission-lines which are easily contrasted against the sky background
The PN spectrograph(How does it really work?)Taylor and Douglas (1995) • Use slitless spectroscopy to detect emission-line sources above the sky background: • Same detection threshold as for direct imaging • Now the position of the PNe in the slitless spectrograph image is a function of: • its “native” position in the sky, modified by … • its velocity – its position is deflected in the dispersion dirn • But, we don’t know its “native” position, so we don’t know its velocity – right? • How do we disentangle the two parameters? • Easy … take 2 slitless spectral images with the dispersion dirn reversed • Now a PNe detection requires searching for image pairs: • Pair separation = Velocity • Pair centre = Position • Pair flux gives distance
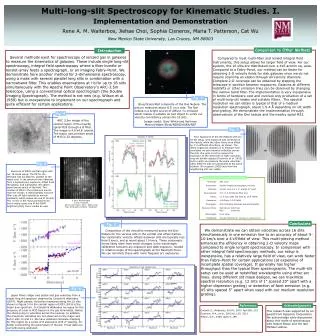
PN Spectrograph Images Narrow-band Image [OIII] Rotate Grating y y x x y-slice through PN y-slice through subtracted pair of images • Differencing image pair gives characteristic PNe signature. Can use optimized pattern recognition software to pull out PNe signatures to determine • (x0,y0)n ; PNe flux ; PNe systemic velocity
PNe PNe It works!